Some business graphs for 2022
Hello! I like looking at other independent authors’ business graphs, so I thought I’d share some percentages and graphs of my own this year. Hopefully some of this is useful to other writers who run internet businesses.
All of the graphs are about Wizard Zines’ business selling zines – I don’t do sponsorships or consulting or commissions or anything.
print vs digital sales
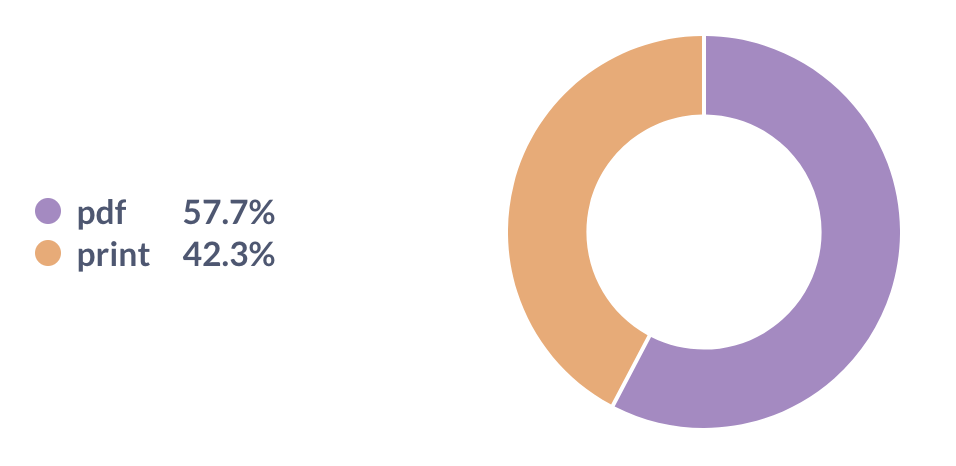
This year 58% of sales were digital and 42% were print. I’m really happy with this: when I decided to start printing and shipping zines in 2021, I was a bit worried that nobody would buy them. But we’ve sold out our first two print runs and it’s been going great.
Note: PDF means "PDF you can read on your computer or print at home", print means "print version that's physically shipped to you"corporate vs personal sales
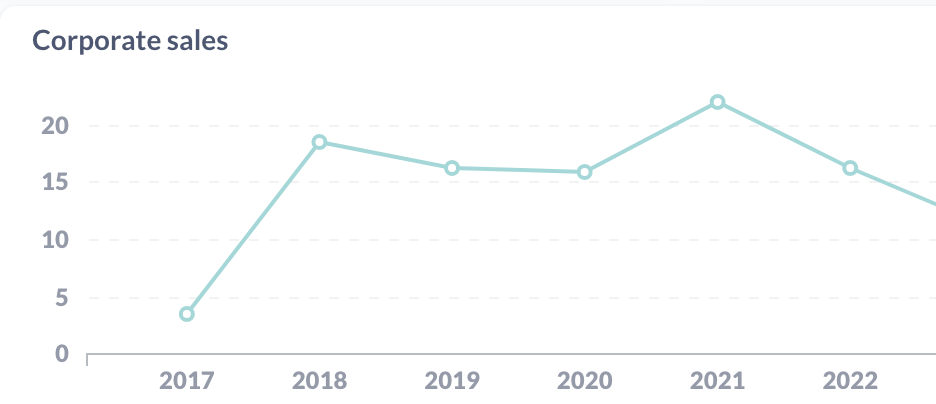
I sell both corporate licenses (“buy this zine for your team!”) and personal copies. I think having corporate sales is great, but it feels like it would be risky to be too dependent on a small number of corporate customers. So I keep an eye on the percentage of corporate sales.
We’re at about 16% corporate sales for 2022 (as a percentage of revenue), which doesn’t seem too high. It looks like this number has been pretty flat over time.
PPP sales
I run a PPP (“purchasing power parity”) program where I give a discount to folks from countries with a weaker currency relative to the US. We’ll look at a couple of things here:
- How many different countries are represented?
- Which countries are the biggest users of PPP?
- What percentage of revenue is from these sales?
Here are some graphs:

People from 81 different countries used the program (so many!!), and the biggest two users are India and Brazil. This has been the case as long as I can remember, presumably because India and Brazil are two of the biggest countries in the world.
About 5% of revenue comes from sales with PPP discounts.
bundles vs individual zines
It used to be that you could only buy individual zines on the store – if you wanted to buy a bundle, you had to buy each one individually. But then one day someone suggested I add a way to buy all of the zines at once.
I did, and this turned out to be a very important business decision – here’s a graph of the percentage of revenue from zine bundles (“packs”) over time:
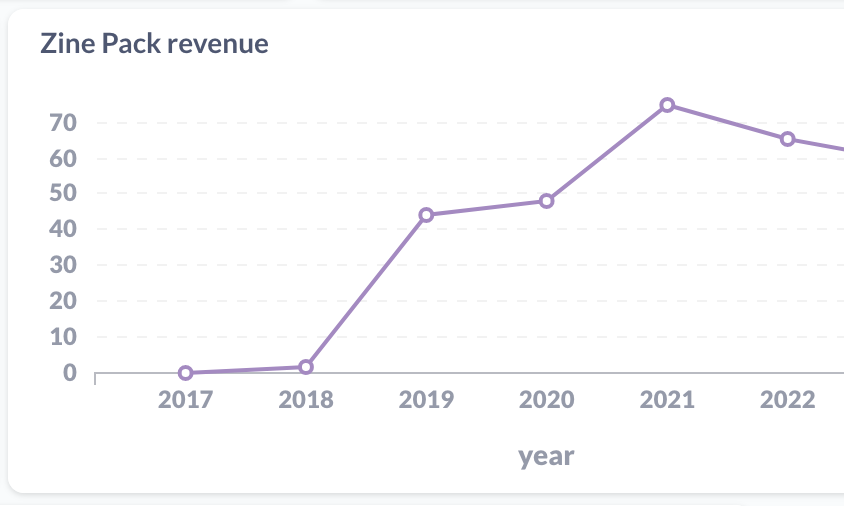
In 2022 it was 65% of revenue (up from 3% in 2018, which I guess is when I added zine packs for the first time).
platforms
I used to sell everything on Gumroad, now I sell everything on Shopify.
I could include some graphs here, but I think it’s not that interesting – it’s mostly a slow migration from 2020 to 2023, where 2020 was 100% Gumroad and 2023 is 100% Shopify.
Some reasons I switched to Shopify:
- I need to sell print zines, and Shopify has inventory management. Also the amazing fulfillment company I use (White Squirrel) uses a Shopify plugin.
- Since I needed to be using Shopify anyway for print zines, it felt easier to have everything on one platform.
- Right now Gumroad charges 10% (7% + processing fees), and Shopify charges $38/month plus processing fees. I actually pay more like $150/month including various Shopify plugins, but for me $150/month is a lot less than 7% of revenue.
Moving from Gumroad to Shopify took probably a month of energy in 2022 but it was worth it to have everything in one place.
revenue graph for 2020-2022
Here’s a graph of (relative) revenue. The blue and the purple are Shopify / Gumroad percentages, because of the Gumroad -> Shopify migration I mentioned in 2021 and 2022.
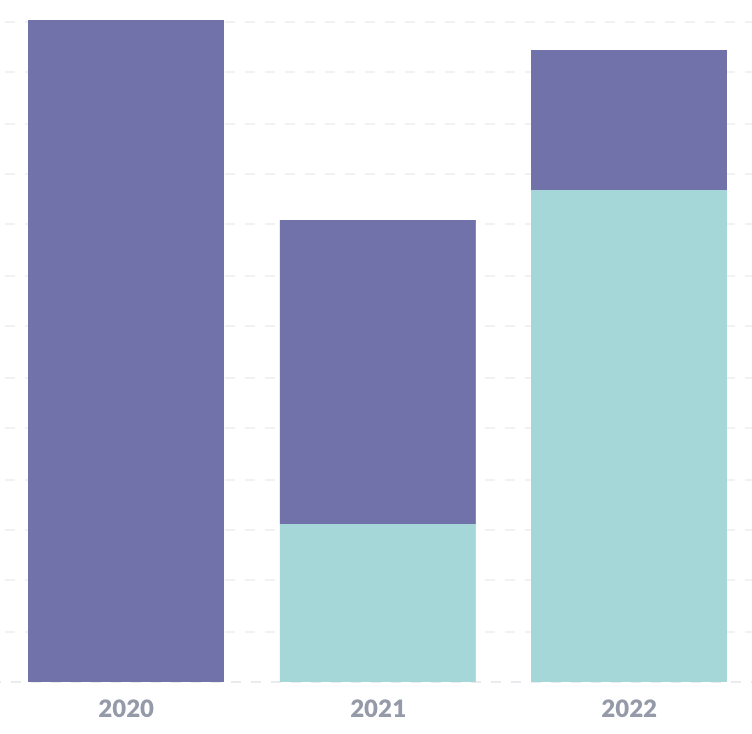
You can see that revenue for 2022 was less than 2020, but quite a bit more than 2021.
This is related to the number of zines released each year:
- 2 zines in 2022 (The Pocket Guide to Debugging and How DNS Works), but only 1
- 1 zine in 2021 (Bite Size Bash)
- 3 zines in 2020 (Become a SELECT Star, How Containers Work, Hell Yes! CSS!)
I put this towards the end because this is not something I try not to worry about too much – every year so far the business has made comfortably enough to pay everyone. If that looks like it might change, I’ll worry about it.
revenue by month
Here’s a graph of revenue by month for 2022 (and the first month of 2023 so far).
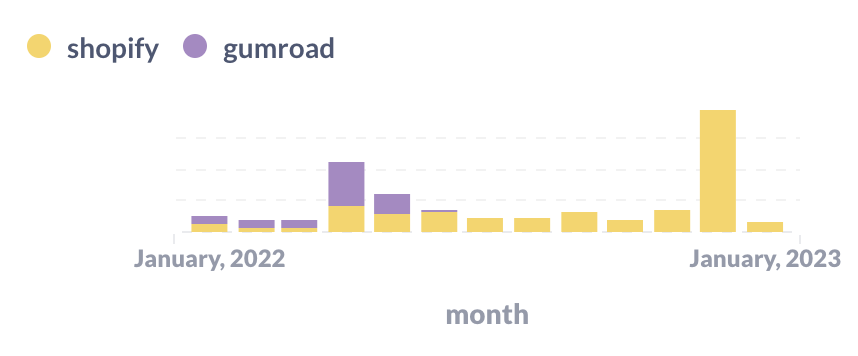
You can see two giant spikes: in April and December when we released new zines. (The Pocket Guide to Debugging has done super well so far, thanks to all of you who bought it! Print copies are on track to ship around the end of January.).
You can also see the Shopify / Gumroad migration happening in this graph – in May I stopped using Gumroad completely.
revenue by country
I got curious about which countries most sales come from, so I drew a graph. I combined the EU into one big group because there are a lot of European countries and I do a lot of special case stuff for Europe (for tax issues etc). Here’s the graph:
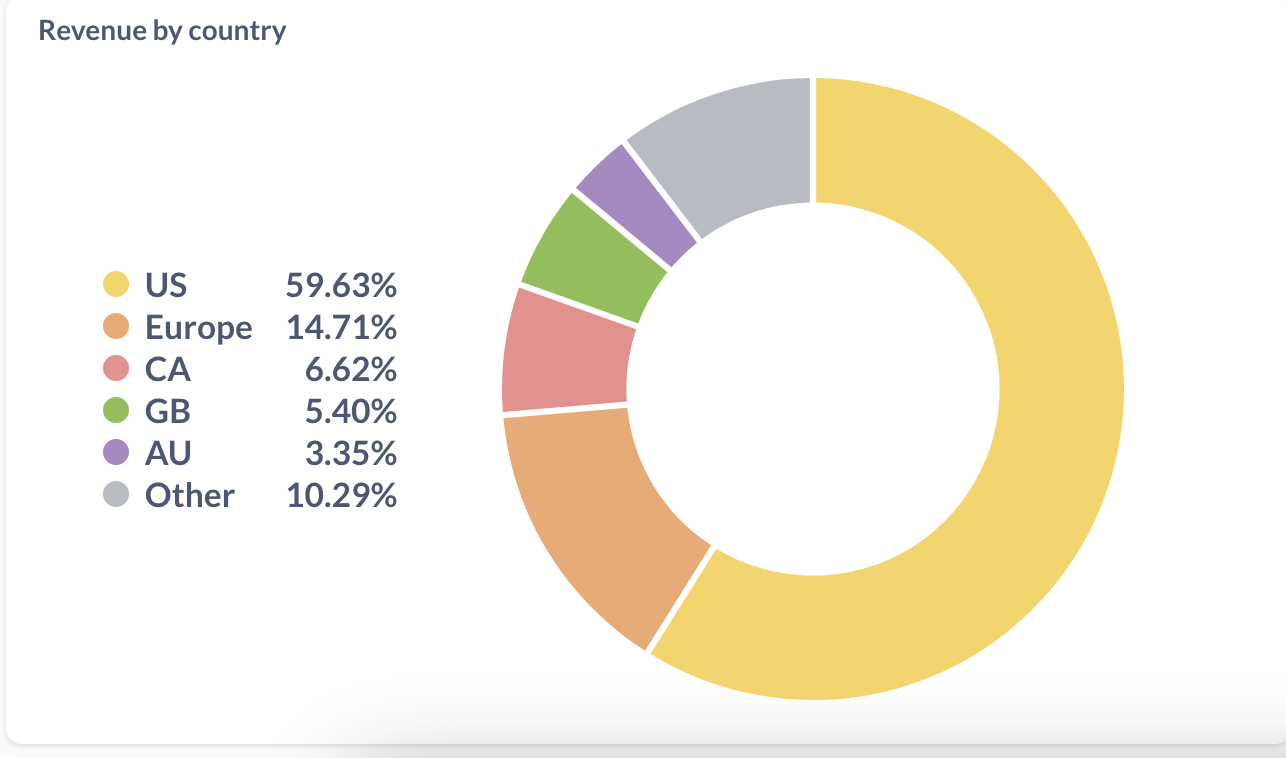
In numbers, that’s:
- US: 59.63%
- Europe: 14.71%
- Canada: 6.62%
- UK: 5.40%
- Australia: 3.35%
- Other: 10.29% (there are 117 countries in there)
Mostly what this tells me is that 40% of revenue comes from outside of the US – that’s a lot! I already offer free international shipping for large orders, but it makes me want to figure out if it’s possible to improve the international shipping situation for small orders too.
If we look at copies by country instead of revenue, this looks a bit different – India and Brazil are both above Australia.
more country data
Here’s a more detailed list of revenue percentages per country, if you want to break that “Europe” category above down more.
- US: 59.65%
- Canada: 6.57%
- United Kingdom: 5.43%
- Germany: 4.81%
- Australia: 3.34%
- France: 1.85%
- Netherlands: 1.58%
- India: 1.41%
- South Africa: 1.3%
- Switzerland: 1.15%
- Spain: 0.88%
- Sweden: 0.87%
- Brazil: 0.85%
- New Zealand: 0.82%
- Ireland: 0.7%
- Singapore: 0.64%
- Poland: 0.62%
- Norway: 0.61%
- Belgium: 0.5%
- Italy: 0.43%
- Finland: 0.42%
- Austria: 0.39%
- Denmark: 0.35%
- Portugal: 0.34%
- Mexico: 0.32%
And the full list of 126 countries where customers came from this year is: Canada, United States, Australia, Netherlands, United Kingdom, Denmark, Austria, Belgium, Spain, Mexico, Italy, Greece, France, Sweden, Finland, Germany, New Zealand, Switzerland, Malaysia, Norway, Israel, India, Iceland, Ireland, Portugal, China, Brazil, Argentina, Colombia, Czechia, Poland, Chile, Saudi Arabia, Bangladesh, Thailand, Belarus, Georgia, South Africa, Serbia, Kenya, Slovenia, Taiwan, Indonesia, Russia, Bhutan, Lithuania, Nigeria, Singapore, Maldives, Morocco, Japan, Sri Lanka, Romania, Egypt, Turkey, El Salvador, Estonia, United Arab Emirates, Malta, Vietnam, Ukraine, Macao, Croatia, Latvia, Jamaica, Iraq, Slovakia, Algeria, Philippines, Ecuador, Cyprus, Bulgaria, Jordan, Montenegro, Pakistan, Hungary, South Korea, Kyrgyzstan, Costa Rica, Ghana, Armenia, Peru, Hong Kong, Kazakhstan, Mongolia, Tunisia, Uruguay, Madagascar, Guatemala, Afghanistan, Angola, Bolivia, Uganda, Tanzania, Venezuela, Dominican Republic, Nepal, Réunion, Antigua and Barbuda, Qatar, Gibraltar, Azerbaijan, Guinea, Moldova, Sudan, Bahamas, Sierra Leone, Seychelles, Pitcairn, Uzbekistan, Bosnia and Herzegovina, Cambodia, Rwanda, Honduras, Benin, Kuwait, Cameroon, Puerto Rico, Turks and Caicos, Trinidad and Tobago, Senegal, North Macedonia, Botswana, Mauritius, Nicaragua.
It’s fun to see so many countries on the list!
how were the graphs generated?
One person asked how these graphs were generated. Basically I have:
- a “data warehouse” (a small 100MB SQLite database)
- a few scripts that use sqlite-utils to import data from the Shopify / Gumroad APIs into the “warehouse”, that run in a cron job on my laptop
- one view that combines my Gumroad sales and Shopify sales into a single table called
all_sales - a Metabase installation on my laptop where I can write SQL to make dashboards and graphs. Metabase is an open source BI tool.
This setup has worked great, I really like Metabase. All of the graphs are screenshots from Metabase.
people
Finally, I want to thank everyone who worked with me on the zines this year. I couldn’t do it without them. We had:
- Marie Claire LeBlanc Flanagan (we worked together on writing pretty much every weekday in 2022)
- Dolly Lanuza (editing)
- Gersande La Flèche (copy editing)
- Vladimir Kašiković (cover illustration)
- All of the beta readers who read and commented on early versions of the zines
- The team at White Squirrel (fulfillment/shipping)
- The team at Girlie Press (printing)
Also my partner Kamal reads every zine before it’s published and he always gives me great advice.
And of course I couldn’t do any of this without the readers who support all of this work ❤.