Profiling Go programs with pprof
Last week me and my cool coworker Josh were debugging some memory problems in a Go program using pprof.
There’s a bunch of pprof documentation on the internet but I found a few things confusing so here are some notes so I can find them easily.
First – when working with pprof it’s good to be running a recent version of Go! For example Go 1.8 adds mutex profiles so you can see mutex contention.
in this post I’ll
- link to the useful pprof resource I found
- explain what a pprof profile is
- give an example of how to look at a heap profile of a Go program
- explain a few things about the heap profiler works (what do the stack traces mean? how are they collected?)
- most importantly (to me), deconstruct an example pprof protobuf file so we understand what a pprof profile actually is
This post won’t really explain in detail how to use pprof to diagnose performance issues in Go programs, but I think these fundamentals (“what even is a pprof file”) will help me do that more easily.
pprof basics
pprof lets you collect CPU profiles, traces, and heap profiles for your Go programs. The normal way to use pprof seems to be:
- Set up a webserver for getting Go profiles (with
import _ "net/http/pprof") - Run
curl localhost:$PORT/debug/pprof/$PROFILE_TYPEto save a profile - Use
go tool pprofto analyze said profile
You can also generate pprof profiles in your code using the pprof package but I haven’t done that.
Useful pprof reading
Here is every useful link I’ve found so far about pprof on the internet. Basically the material on the internet about pprof seems to be the official documentation + rakyll’s amazing blog.
- Setting up a pprof webserver: https://golang.org/pkg/net/http/pprof/
- Generating pprof profiles in code: https://golang.org/pkg/runtime/pprof/
- https://github.com/google/pprof (from which I found out that
pprofcan read perf files!!) - The developer docs: https://github.com/google/pprof/blob/master/doc/pprof.md
- The output of
go tool pprof --help(I pasted the output on my system here) - @rakyll’s blog, which has a huge number of great posts about pprof: https://rakyll.org/archive/. In particular this post on custom pprof profile types and this on the newish profile type for seeing contended mutexes are great.
(there are probably also talks about pprof but I am too impatient to watch talks, that’s part of why I write lots of blog posts and give few talks)
What’s a profile? What kinds of profiles can I get?
When understanding how things work I like to start at the beginning. What is a “profile” exactly?
Well, let’s read the documentation! The 7th time I looked at the runtime/pprof docs, I read this very useful sentence:
A Profile is a collection of stack traces showing the call sequences that led to instances of a particular event, such as allocation. Packages can create and maintain their own profiles; the most common use is for tracking resources that must be explicitly closed, such as files or network connections.
Each Profile has a unique name. A few profiles are predefined:
goroutine    - stack traces of all current goroutines
heap         - a sampling of all heap allocations
threadcreate - stack traces that led to the creation of new OS threads
block        - stack traces that led to blocking on synchronization primitives
mutex        - stack traces of holders of contended mutexes
There are 7 places you can get profiles in the default webserver: the ones mentioned above
- http://localhost:6060/debug/pprof/goroutine
- http://localhost:6060/debug/pprof/heap
- http://localhost:6060/debug/pprof/threadcreate
- http://localhost:6060/debug/pprof/block
- http://localhost:6060/debug/pprof/mutex
and also 2 more: the CPU profile and the CPU trace.
- http://localhost:6060/debug/pprof/profile
- http://localhost:6060/debug/pprof/trace?seconds=5
To analyze these profiles (lists of stack traces), the tool to use is go tool pprof, which is a bunch of
tools for visualizing stack traces.
super confusing note: the trace endpoint (/debug/pprof/trace?seconds=5), unlike all the rest, outputs a file that is not a
pprof profile. Instead it’s a trace and you can view it using go tool trace (not go tool pprof).
You can see the available profiles with http://localhost:6060/debug/pprof/ in your browser. Except
it doesn’t tell you about /debug/pprof/profile or /debug/pprof/trace for some reason.
All of these kinds of profiles (goroutine, heap allocations, etc) are just collections of
stacktraces, maybe with some metadata attached. If we look at the pprof protobuf definition, you see that a profile is mostly a bunch of Samples.
A sample is basically a stack trace. That stack trace might have some extra information attached to it! For example in a heap profile, the stack trace has a number of bytes of memory attached to it. I think the Samples are the most important part of the profile.
We’re going to deconstruct what exactly is inside a pprof file later, but for now let’s start by doing a quick example of what analyzing a heap profile looks like!
Getting a heap profile with pprof
I’m mostly interested in debugging memory problems right now. So I decided to write a program that allocates a bunch of memory to profile with pprof.
func main() {
    // we need a webserver to get the pprof webserver
    go func() {
        log.Println(http.ListenAndServe("localhost:6060", nil))
    }()
    fmt.Println("hello world")
    var wg sync.WaitGroup
    wg.Add(1)
    go leakyFunction(wg)
    wg.Wait()
}

func leakyFunction(wg sync.WaitGroup) {
    defer wg.Done()
    s := make([]string, 3)
    for i:= 0; i < 10000000; i++{
        s = append(s, "magical pandas")
        if (i % 100000) == 0 {
            time.Sleep(500 * time.Millisecond)
        }
    }
}
Basically this just starts a goroutine leakyFunction that allocates a bunch of memory and then
exits eventually.
Getting a heap profile of this program is really easy – we just need to run go tool pprof http://localhost:6060/debug/pprof/heap. This puts us into an interactive mode where we run top
$ go tool pprof  http://localhost:6060/debug/pprof/heap
    Fetching profile from http://localhost:6060/debug/pprof/heap
    Saved profile in /home/bork/pprof/pprof.localhost:6060.inuse_objects.inuse_space.004.pb.gz
    Entering interactive mode (type "help" for commands)
(pprof) top
    34416.04kB of 34416.04kB total (  100%)
    Showing top 10 nodes out of 16 (cum >= 512.04kB)
          flat  flat%   sum%        cum   cum%
       33904kB 98.51% 98.51%    33904kB 98.51%  main.leakyFunction
I can also do the same thing outside interactive mode with go tool pprof -top http://localhost:6060/debug/pprof/heap.
This basically tells us that main.leakyFunction is using 33.9MB of memory. Neat!
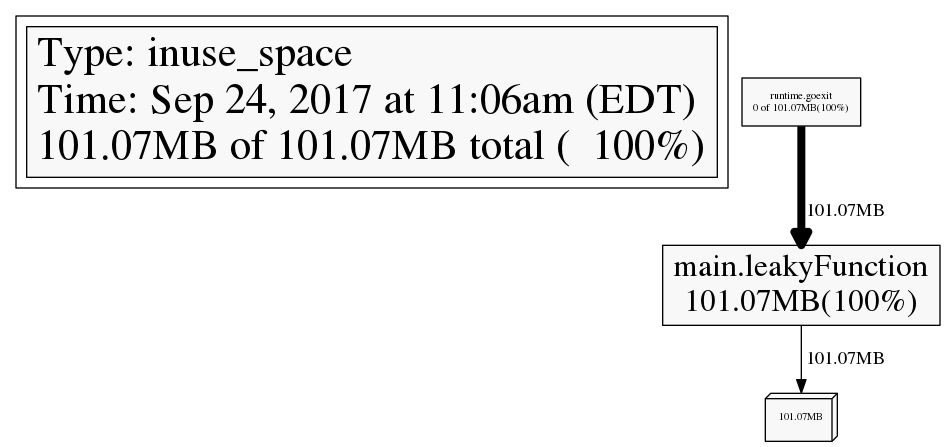
We can also generate a PNG profile like this: go tool pprof -png http://localhost:6060/debug/pprof/heap > out.png.
Here’s what that looks like (I ran it at a different time so it’s only using 100MBish of memory).
what do the stack traces in a heap profile mean?
This is not complicated but also was not 100% obvious to me. The stack traces in the heap profile are the stack trace at time of allocation.
So the stack traces in the heap profile might be for code that is not running anymore – like maybe a function allocated a bunch of memory, returned, and a different function that should be freeing that memory is misbehaving. So the function to blame for the memory leak might be totally different than the function listed in the heap profile.
alloc_space vs inuse_space
go tool pprof has the option to show you either allocation counts or in use memory. If you’re concerned with the amount of memory being used, you probably want the inuse metrics, but if you’re worried about time spent in garbage collection, look at allocations!
  -inuse_space      Display in-use memory size
  -inuse_objects    Display in-use object counts
  -alloc_space      Display allocated memory size
  -alloc_objects    Display allocated object counts
I was originally confused about this works – the profiles have already be collected! How can I make this choice after the fact? I think how the heap profiles work is – allocations are recorded at some sample rate. Then every time one of those allocation is freed, that’s also recorded. So you get a history of both allocations and frees for some sample of memory activity. Then when it comes time to analyze your memory usage, you can decide where you want inuse memory or total allocation counts!
You can read the source for the memory profiler here: https://golang.org/src/runtime/mprof.go. It has a lot of useful comments! For example here are the comments about setting the sample rate:
// MemProfileRate controls the fraction of memory allocations
// that are recorded and reported in the memory profile.
// The profiler aims to sample an average of
// one allocation per MemProfileRate bytes allocated.

// To include every allocated block in the profile, set MemProfileRate to 1.
// To turn off profiling entirely, set MemProfileRate to 0.

// The tools that process the memory profiles assume that the
// profile rate is constant across the lifetime of the program
// and equal to the current value. Programs that change the
// memory profiling rate should do so just once, as early as
// possible in the execution of the program (for example,
// at the beginning of main).
pprof fundamentals: deconstructing a pprof file
When I started working with pprof I was confused about what was actually happening. It was
generating these heap profiles named like pprof.localhost:6060.inuse_objects.inuse_space.004.pb.gz
– what is that? How can I see the contents?
Well, let’s take a look!! I wrote an even simpler Go program to get the simplest possible heap profile.
package main

import "runtime"
import "runtime/pprof"
import "os"
import "time"

func main() {
    go leakyFunction()
    time.Sleep(500 * time.Millisecond)
    f, _ := os.Create("/tmp/profile.pb.gz")
    defer f.Close()
    runtime.GC()
    pprof.WriteHeapProfile(f);
}

func leakyFunction() {
    s := make([]string, 3)
    for i:= 0; i < 10000000; i++{
        s = append(s, "magical pprof time")
    }
}
This program just allocates some memory, writes a heap profile, and exits. Pretty simple. Let’s look
at this file /tmp/profile.pb.gz! You can download a gunzipped version profile.pb
here: profile.pb. I installed protoc using these directions.
profile.pb is a protobuf file, and it turns out you can view protobuf files with protoc, the
protobuf compiler.
go get github.com/google/pprof/proto
protoc --decode=perftools.profiles.Profile  $GOPATH/src/github.com/google/pprof/proto/profile.proto --proto_path $GOPATH/src/github.com/google/pprof/proto/
The output of this is a bit long, you can view it all here: output.
Here’s a summary though of what’s in this heap profile file! This contains 1 sample. A sample is a stack trace, and this stack trace has 2 locations: 1 and 2. What are locations 1 and 2? Well they correspond to mappings 1 and 2, which in turn correspond to filenames 7 and 8.
If we look at the string table, we see that filenames 7 and 8 are these two:
string_table: "/home/bork/work/experiments/golang-pprof/leak_simplest"
string_table: "[vdso]"
sample {
  location_id: 1
  location_id: 2
  value: 1
  value: 34717696
  value: 1
  value: 34717696
}
mapping {
  id: 1
  memory_start: 4194304
  memory_limit: 5066752
  filename: 7
}
mapping {
  id: 2
  memory_start: 140720922800128
  memory_limit: 140720922808320
  filename: 8
}
location {
  id: 1
  mapping_id: 1
  address: 5065747
}
location {
  id: 2
  mapping_id: 1
  address: 4519969
}
string_table: ""
string_table: "alloc_objects"
string_table: "count"
string_table: "alloc_space"
string_table: "bytes"
string_table: "inuse_objects"
string_table: "inuse_space"
string_table: "/home/bork/work/experiments/golang-pprof/leak_simplest"
string_table: "[vdso]"
string_table: "[vsyscall]"
string_table: "space"
time_nanos: 1506268926947477256
period_type {
  type: 10
  unit: 4
}
period: 524288
pprof files don’t always contain function names
One interesting thing about this pprof file profile.pb is that it doesn’t contain the names of the
functions we’re running! But If I run go tool pprof on it, it prints out the name of the leaky
function. How did you do that, go tool pprof?!
go tool pprof -top  profile.pb
59.59MB of 59.59MB total (  100%)
      flat  flat%   sum%        cum   cum%
   59.59MB   100%   100%    59.59MB   100%  main.leakyFunction
         0     0%   100%    59.59MB   100%  runtime.goexit
I answered this with strace, obviously – I straced go tool pprof and this is what I saw:
5015  openat(AT_FDCWD, "/home/bork/pprof/binaries/leak_simplest", O_RDONLY|O_CLOEXEC <unfinished ...>
5015  openat(AT_FDCWD, "/home/bork/work/experiments/golang-pprof/leak_simplest", O_RDONLY|O_CLOEXEC) = 3
So it seems that go tool pprof noticed that the filename in profile.pb was /home/bork/work/experiments/golang-pprof/leak_simplest, and then it just opened up that file on my computer and used that to get the function names. Neat!
You can also pass the binary to go tool pprof like go tool pprof -out $BINARY_FILE myprofile.pb.gz. Sometimes pprof files contain function names and
sometimes they don’t, I haven’t figured out what determines that yet.
pprof keeps improving!
also I found out that thanks to the great work of people like rakyll, pprof keeps getting better!! For example There’s this pull request https://github.com/google/pprof/pull/188 which is being worked on RIGHT NOW which adds flamegraph support to the pprof web interface. Flamegraphs are the best thing in the universe so I’m very excited for that to be available.
If I got something wrong (I probably did) let me know!!