A/A testing
Thursday evening I organized a meetup called Data Science: Inconvenient Truths where the amazing Diyang Tang, Clare Corthell, and Elena Grewal told great stories about things that have gone wrong when doing machine learning or data analysis.
Elena gave a talk (video of a previous version) about common mistakes you can make when running experiments. I was super excited to hear her talk because I’m working on an experiment right now at work and trying to interpret the results. The whole talk is great – it has really good examples of experiments Airbnb has worked on – and you should watch it, but I want to talk about the very small part where she mentions A/A testing.
I’ve heard of A/B testing! But I’d never heard of A/A testing before, didn’t really understand what she meant at the time, and didn’t manage to ask. (pro tip: ask questions when you have them :)). I slept on it, and I now think a) that I get it and b) it’s really simple and c) that it’s SUPER COOL AND MAYBE USEFUL TO ME.
Let’s pretend I have a widget store, and that I’m running an experiment where I have a Great Idea that I think will sell WAY MORE WIDGETS. I’ve rolled out my Great Idea to 33% of users, and I have a gorgeous dashboard that says that my Great Idea group has 2% higher sales than my other group, like this:
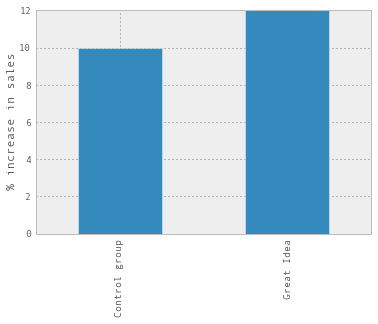
A 2% increase in sales is a pretty big deal! But how do I know that these results are actually significant? One great way is to do statistics – Dan McKinley built this calculator which you can see here that makes some assumptions and tells you how long you’ll need to run your experiment for to see statistical significance.
But let’s say you want to get a rough sense for whether or not your results might be significant without doing statistics.
This is where A/A testing comes in! The idea here is to compare two sets of users in the same experimental group and see how high the variation is. So instead of having a Great Idea group and a Control Group, we’ll use two control groups. And then we might see something like this:
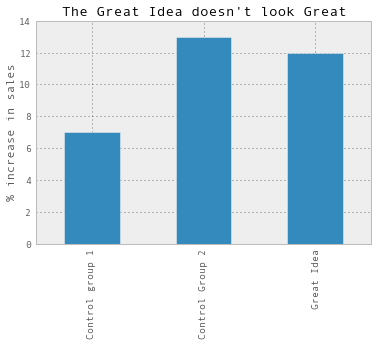
Suddenly, the group we’re experimenting on doesn’t look so good anymore. It looks like any difference is likely to be just because of random noise. If we’d instead seen something like this, we’d be much more likely to believe that the Great Idea is actually doing well:
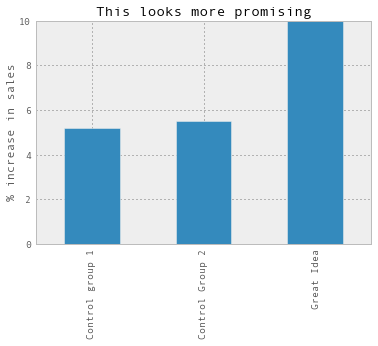
I like this because it seems like it can give you a rough sense for how significant your results are without having to decide on a statistical model. And it’s super intuitive! A question like “if we compare two groups of this size with the same characteristics, do we naturally see a lot of variation?” is a great smoke test.
Once I got off a plane and looked up what A/A testing actually is, I found out the graph above has a name! It’s called A/A/B testing, and A/A testing is when you literally just run an experiment where both groups are the same :)