Reverse engineering the Notability file format
I spend a fair amount of time drawing comics about programming. (I have a new zine called “profiling & tracing with perf”! Early access is $10, if you want to read it today!)
So on Thursday, I bought an iPad + Apple Pencil, because the Apple Pencil is a very nice tool for drawing. I started using the Notability app for iPad, which seems pretty nice. But I had a problem: I have dozens of drawings already in the Android app I was using: Squid!
Notability does have a way to import PDFs, but they become read-only – you can draw on top of them, but you can’t edit them. That’s annoying!
Here’s the rough dialog that ensued:
- Julia: “I want to convert my old drawings to the new app but there’s no way to do it!!”
- Kamal: “well what if you reverse engineered the Notability file format?”
- Julia: “hmm that sounds like it would take a long time”
- Kamal: “maybe just spend an hour on it and see what happens!”
- Julia: “okay!!!!!”
So! The plan was to figure out how to convert SVGs to Notability’s native format (.note). This is
a proprietary format, and nobody else seemed to have reverse engineered it yet, so I started from
scratch.
If you want to use my terrible code to convert SVGs to Notability, here’s the github repo: svg2notability. It comes out to less than 200 lines of Python.
I thought I’d write up the process of reverse engineering this file format because it wasn’t really THAT hard, and reverse engineering often seems kind of unapproachable and scary. I started doing this yesterday, and as of this evening I have something that works well enough for me to start using it.
In this post, I’ll explain how I figured out how this Notability .note format works!
step 0: start with a .note file
I exported a .note file from the app, put it in Dropbox, and copied it to my Linux computer. Easy.
It’s called template.note.
step 1: unzip the file
What’s a .note file? Well, the way we figure out what files are is we run file on them! Turns
out it’s a zip file:
$ file template.note
template.note: Zip archive data, at least v2.0 to extract
$ unzip template.note
That decompresses into a directory called template/. Here are the files in it:
$ find template/
template/
template/thumbnail
template/Assets
template/Session.plist
template/thumb3x.png
template/Recordings
template/Recordings/library.plist
template/thumb2x.png
template/thumbnail2x
template/metadata.plist
template/Images
template/thumb6x.png
template/thumb.png
Okay, neat! What’s a .plist file?
step 2: decode the .plist file
Google (and file) tell us that a .plist file is some kind of Apple format. Okay! Google says
that there’s both an XML format, and a binary format. This one is the binary format.
$ file template/Session.plist
template/Session.plist: Apple binary property list
I’m temporarily worried by this, but some more Googling reveals that there’s a Linux utility
called plistutil that I can use to translate between them. sudo apt install plistutil gets me
the utility!
I convert all the binary .plist files to XML, look at them, and it becomes clear that
template/Session.plist is the file with the drawing data. You can see what it looks like here once
it’s decoded as XML: notability_session.xml.
How could you tell that it was where the drawing data was, Julia? Well, it had these very temptingly named fields like “curvespoints”. Like this:
<key>curvespoints</key>
<data>
mgG+QjOrB0NmuUBDVT3MQgA5kUNEJIlCTBXCQ2YWDEIAT7JCM4tqQ+YFUEMzGVlDJnKj
QzOnR0Na4d5DMzU2QzMzukKafLZDM5dZQ2aDrkNmCqtDM4qmQzNJ6UMAkZ5DZpadQjPQ
A0SFx51CsM4DRHjvnUI7zQNEsRCeQrTLA0QiU55CpsgDRKl6nkJUxQNEzZqeQs3AA0Sv
rp5CEr8DRHW3nkIdvQNEM82eQma4A0RNHJ9CrqkDRNV2n0KUmANEmtGfQs2IA0QoPqBC
p3UDRJugoEINZQNEANagQs1eA0SKIaFCC1QDREOEoULIRgNEzQyiQoA1A0TpVKJCUSsD
ROCWokKvIgNEzcmiQrMdA0SVk6NCtAgDRH10pEJr9gJEzZOlQmbfAkTyaadCkrUCRFb8
qUKYewJEmjCtQmY+AkTkaLBCSQICRKEqtEIkyAFEAPi3QjOSAUS+RbtCMGMBRK6lvkKk
MwFEANDBQmYDAURBQMZCHb0ARCxqykKSdgBEzQDPQrMwAET6vtNCwdL/Q34M2UJwPv9D
mT7eQpm6/kNsXuNCcjr+QzQE6EIV2f1DM7vsQjNi/UMSDu9C6CT9Qztz8UIY4fxDmRD0
QpmY/EMwL/ZC3F/8Q0Fu+EKoJPxDM8L6Qmbl+0N9tf1Ck5P7Q6JnAENsOvtDmu4BQ5nf
+kOgxgJDQK36Q0OWA0MCe/pDmmQEQ5lF+kNbgQVDQ/v5Q6yaBkMkr/lDZr0HQzNk+UPB
...
</data>
One might think this “curvespoints” data represents… the points on the curves in the file. Spoiler: it does.
step 3: decoding the points on the curve
This is going to sound pretty straightforward but in real life I was more confused and complained more. Here’s how I decoded what this “curvespoints” thing was
- Realize it’s base 64 encoded. This part was easy: I’ve worked with base64 encoded data before, and it’s how binary data is often encoded in a text file. Cool.
- Look at the data in hexdump
- Be confused (“this just random bytes?!!? how can I know what this means??”)
- Try to see if it’s msgback (no), bencode (no). Be confused. Complain. Repeat for an hour or so.
- Finally think “wait, what if it’s just an array of 32-bit floats????? That would be simple and it would make sense!!”
- Try to decode it as an array of 32 bit floats
- It just works
Here’s the Python code I used to decode it as an array of 32 bit floats. It turns out that core Python has a built in module for parsing plist files (?!!?). So that was useful.
import subprocess
import plistlib
import struct

def unpack_struct(string, fmt):
    return struct.unpack('{num}{format}'.format(num=len(string)/4, format=fmt), string)

plistlib.readPlistFromString(subprocess.check_output(['plistutil', '-i', 'file.plist']))
curves_points = pl['$objects'][8]['curvespoints'].data
unpack_struct(curvespoints, 'f')
Here are some of the floats that came out of my file. These look pretty clearly like points on a curve: it’s an array of floats, and each group of 2 consecutive floats is a point on the curve. Neat!!
(407.59869384765625,
 396.6827087402344,
 408.05926513671875,
 396.3546447753906,
 408.2127990722656,
 396.2452697753906,
 408.3787536621094,
 396.1249084472656,
 408.55938720703125,
 395.9921875)
step 4: decode everything else
Decoding the other bits was pretty straightforward: there’s
curvesnumpoints: array of 32 bit integers, which is the number of points on each curve (unpack_struct(curves['curvesnumpoints'].data, 'i')),curveswidth: array of 32 bit floats, thickness of each curvecurvescolors: array of 32-bit RGBA values (0x00FFEEFFis the hex code#00FFEE, the last bit is the opacity)curvesfractionalwidths: multiplier of width for variable length curves. I didn’t care about these, I set all of them to 1.0.eventTokens: not sure, I just set all of these to the float1.0and it seemed to work fine
step 5: plot the points on a graph!!
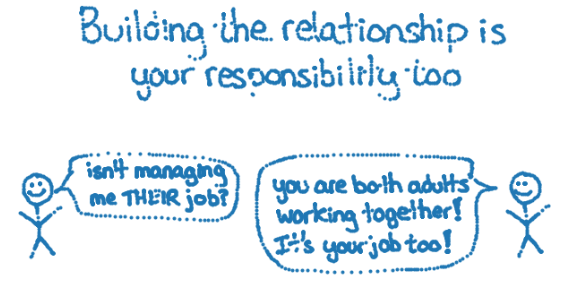
To make sure that the points actually were points, I plotted them on a graph!!! In this example I was actually using an image from a zine idea I had about working with your manager. Here’s what it looked like:

So cool!!!! I was extremely jazzed about my success. Also it was 5pm and time to go for dinner at a friend’s house, so I did that.
step 5: generate the .note file
Okay, now we have some belief that we know how this file format works. How can we generate files of this format?
The basic game plan was:
- start with an existing empty
.notefile. - Keep everything about it the same except the
Session.plistfile, where the drawing data is. - Change the
curvesnumpoints,curveswidth,curvescolors, etc data - Zip it back up, import it into my app, and hope it works!!!
One debugging tactic that helped me along the way: I tried to regenerate an existing .plist file that I already had. I got the
list of points that I thought it represented, and generated the curvesnumpoints, etc fields myself
and made sure they matched up with the real data that Notability had for those files. Then I turned
that into a unit test!
There were a bunch of weird artifacts and bugs along the way, but this blog post is already pretty long and I don’t think it’s interesting to explain this.
the results
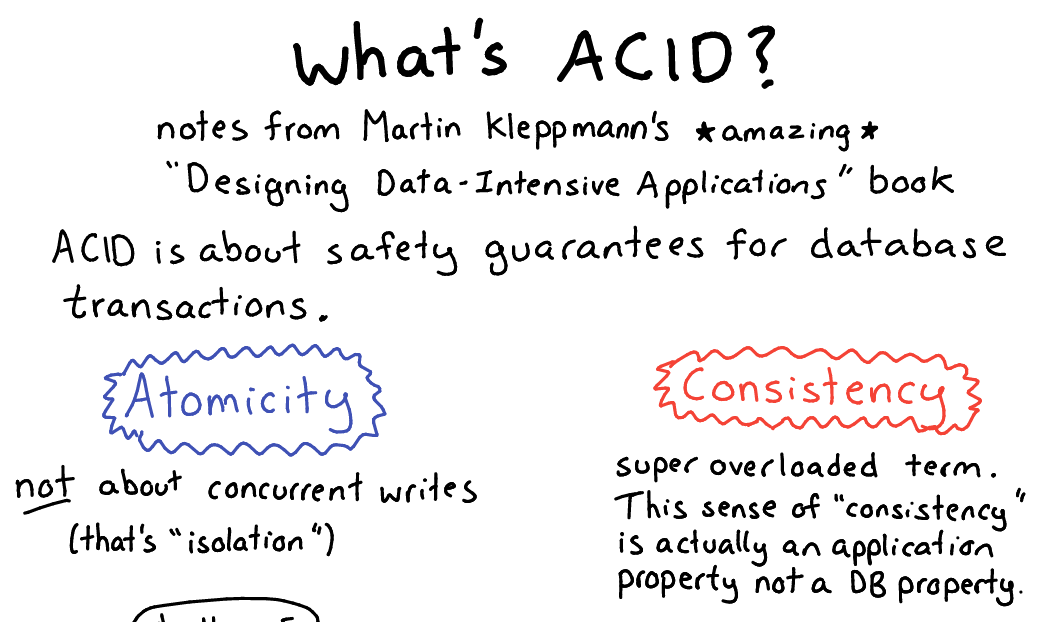
Here are the results! First, here’s what the SVG that I input into my svg2notability program looks like:

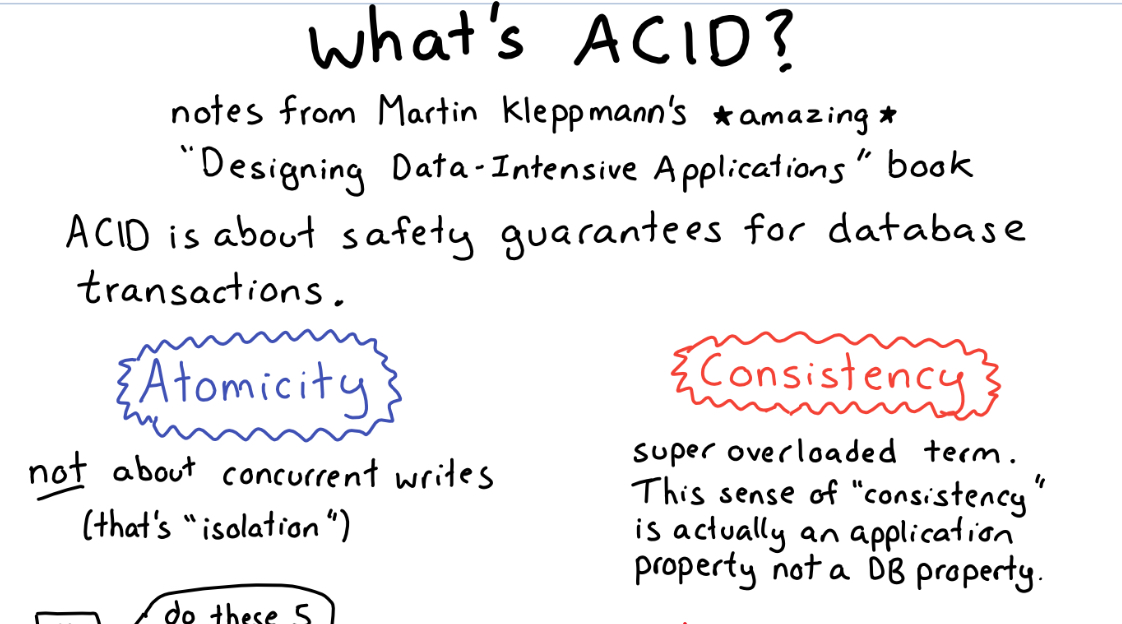
And here it is in Notability, after I converted it! It looks basically the same! And I can easily edit it, which was the point. The colours worked and everything!

what doesn’t work
things I didn’t get to work (though presumably I could if I wanted to spend more time):
- generating documents with multiple pages (didn’t try)
- drawing squares – some of my drawings have perfect squares in them and there’s a bug with them that I haven’t worked out yet
- changing the paper size in Notability to match the original paper size. Instead I just scale the width to match Notability’s default paper width, which is very hacky but may be good enough.
there are only so many file formats
I think the thing that makes reverse engineering not that hard is – developers reuse code! People don’t usually invent totally custom file formats! Nothing in here was really complicated – it was just some existing standard formats (zip! apple plist! an array of floats!) combined together in a pretty simple way.
that’s all!
It’s really fun to start with a seemingly intractable or very manual task, think “wait, I’m a programmer!!” and manage to use the power of programming to (at least sort of) do what I want!
I do find it kind of frustrating that all these mobile drawing apps (Squid, Notability, Goodnotes, etc) use proprietary file formats and you can’t convert between them without reverse engineering. But reverse engineering is possible!! squid_decoder reverse engineered the Squid format (it’s basically a google protocol buffer)
If you want to read the code for some reason it’s at https://github.com/jvns/svg2notability.