Linux tracing systems & how they fit together
I’ve been confused about Linux tracing systems for years. There’s strace, and
ltrace, kprobes, and tracepoints, and uprobes, and ftrace, and perf, and eBPF,
and how does it all fit together and what does it all MEAN?
Last week I went to Papers We Love and later me & Kamal hung out with
Suchakra at Polytechnique Montréal (where LTTng comes from) and
finally I think I understand how all these pieces fit together, more or less.
There are still probably some mistakes in this post, please let me know what
they are! (I’m b0rk on twitter).
I’m going to leave strace out of this post (even though it’s my favorite thing) because the overhead is so high – in this post we’re only going to talk about tracing systems that are relatively fast / low overhead. This post also isn’t about sampling profilers at all (which is a whole other topic!). Just tracing.
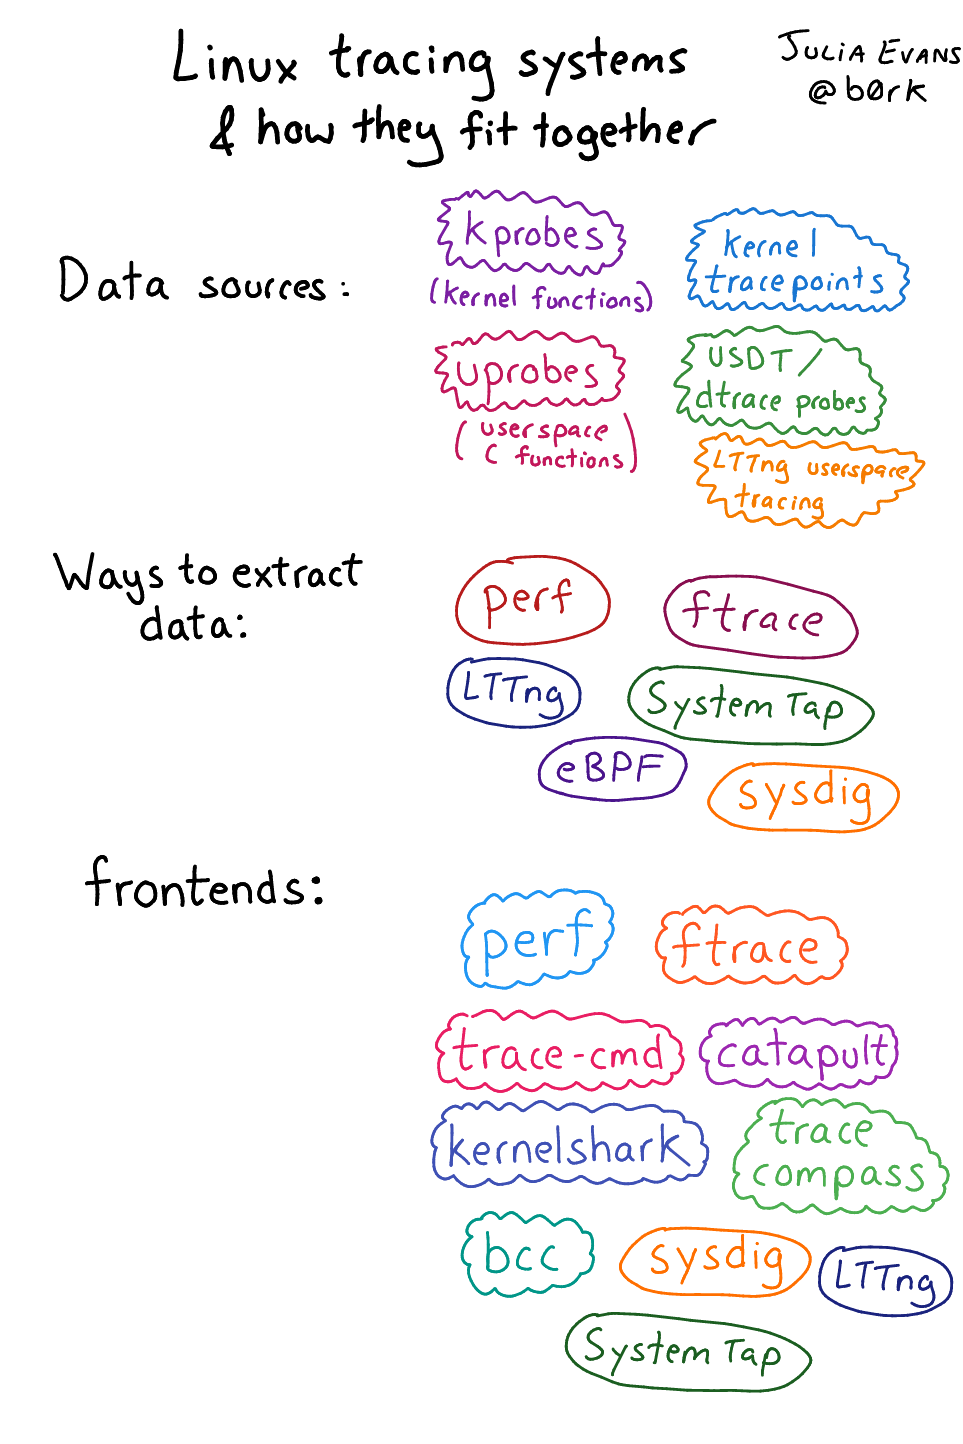
The thing I learned last week that helped me really understand was – you can split linux tracing systems into data sources (where the tracing data comes from), mechanisms for collecting data for those sources (like “ftrace”) and tracing frontends (the tool you actually interact with to collect/analyse data). The overall picture is still kind of fragmented and confusing, but it’s at least a more approachable fragmented/confusing system.
here’s what we’ll talk about: (with links if you want to jump to a specific section).
- summary in pictures
- What can you trace?
- Data sources:
- Mechanisms for collecting your delicious data:
- User frontends:
perf- Various ftrace frontends (trace-cmd, catapult, kernelshark,
perf-tools) - The bcc frontend for eBPF
- LTTng & SystemTap frontends
- some conclusions
It’s still kind of complicated but breaking it up this way really helps me understand (thanks to Brendan Gregg for suggesting this breakdown on twitter!)
a picture version
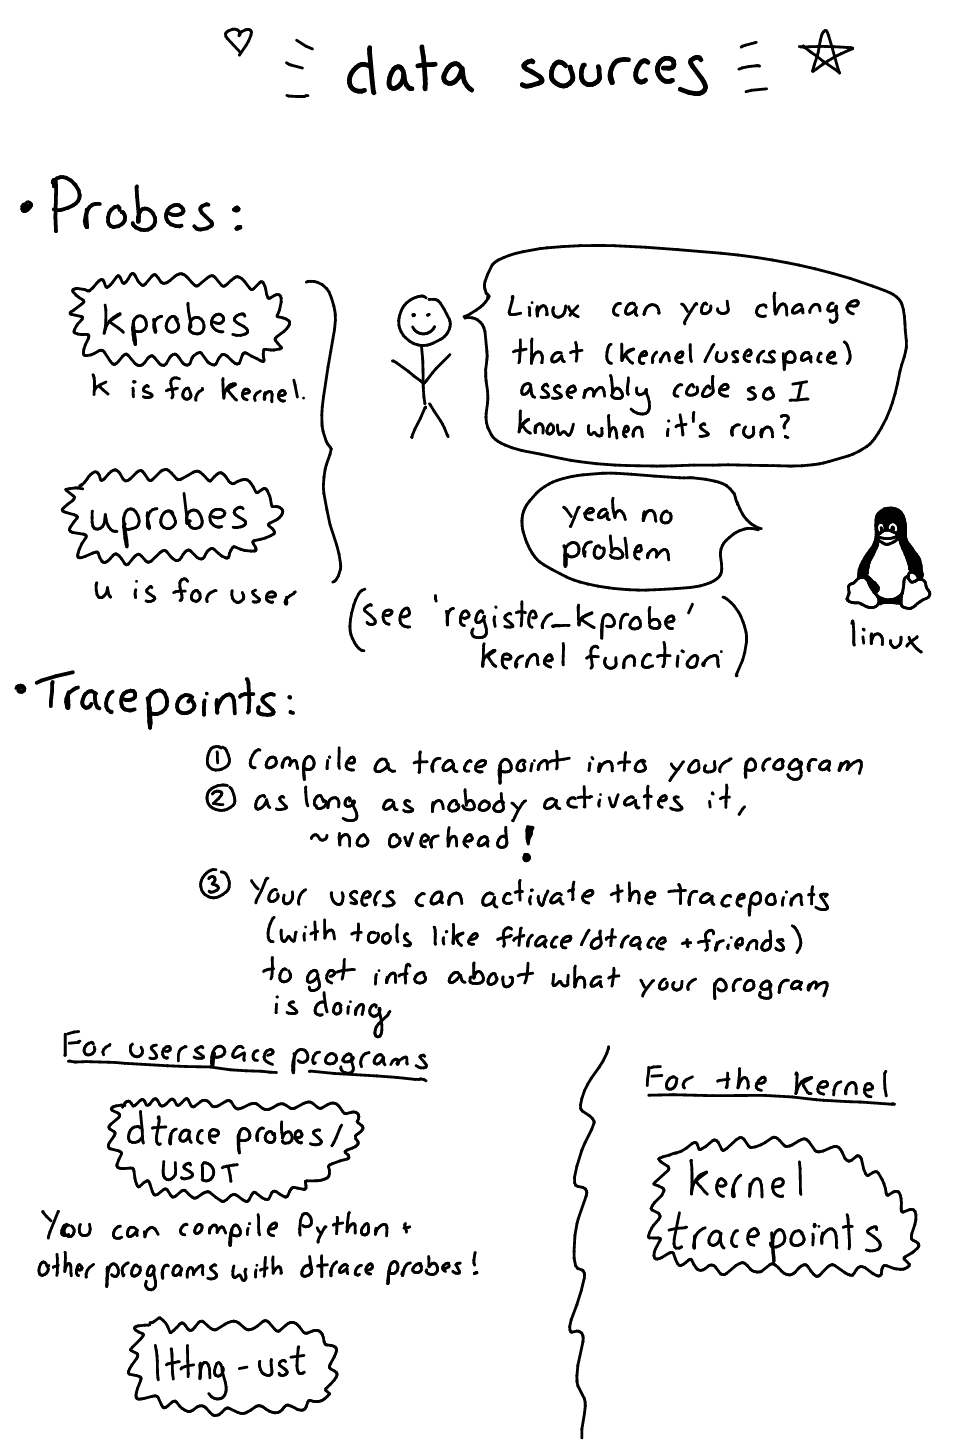
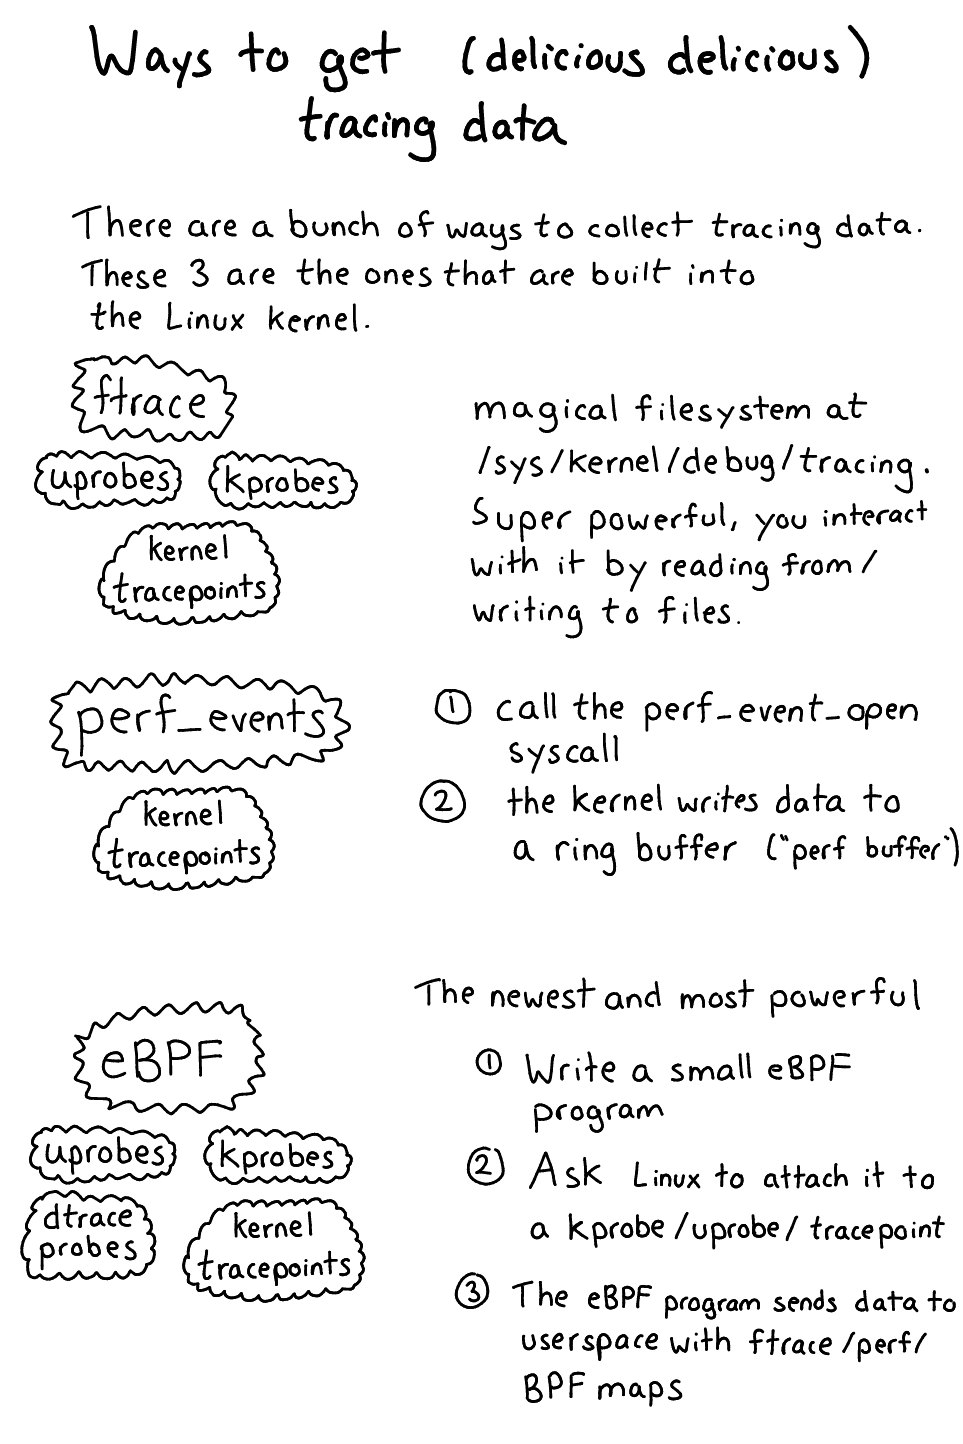
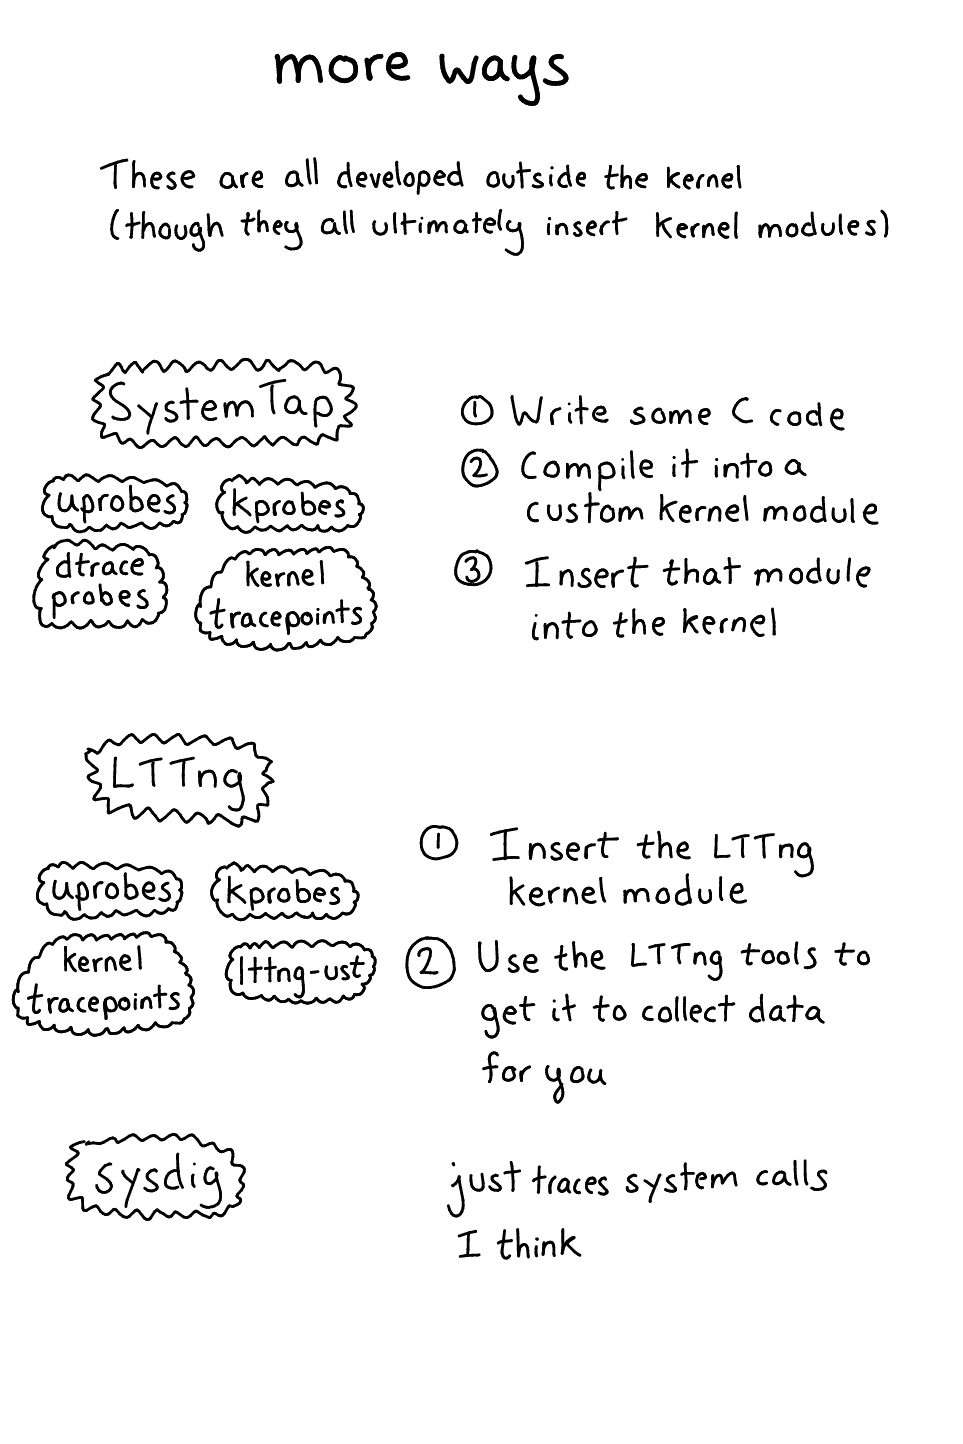
here are 6 drawings summarizing what this post is about:
What can you trace?
A few different kinds of things you might want to trace:
- System calls
- Linux kernel function calls (which functions in my TCP stack are being called?)
- Userspace function calls (did
mallocget called?) - Custom “events” that you’ve defined either in userspace or in the kernel
All of these things are possible, but it turns out the tracing landscape is actually pretty complicated.
Data sources: kprobes, tracepoints, uprobes, dtrace probes & more
Okay, let’s do data sources! This is kind of the most fun part – there are so many EXCITING PLACES you can get data about your programs.
I’m going to split these up into “probes” (kprobes/uprobes) and “tracepoints” (USDT/kernel tracepoints / lttng-ust). I’m think I’m not using the right terminology exactly but there are 2 distinct ideas here that are useful to understand
A probe is when the kernel dynamically modifies your assembly program at runtime (like, it changes the instructions) in order to enable tracing. This is super powerful (and kind of scary!) because you can enable a probe on literally any instruction in the program you’re tracing. (though dtrace probes aren’t “probes” in this sense). Kprobes and uprobes are examples of this pattern.
A tracepoint is something you compile into your program. When someone using your program wants to see when that tracepoint is hit and extract data, they can “enable” or “activate” the tracepoint to start using it. Generally a tracepoint in this sense doesn’t cause any extra overhead when it’s not activated, and is relatively low overhead when it is activated. USDT (“dtrace probes”), lttng-ust, and kernel tracepoints are all examples of this pattern.
Next up is kprobes! What’s that? From an LWN article:
KProbes are a debugging mechanism for the Linux kernel which can also be used for monitoring events inside a production system. You can use it to weed out performance bottlenecks, log specific events, trace problems etc.
To reiterate – basically kprobes let you dynamically change the Linux kernel’s assembly code at runtime (like, insert extra assembly instructions) to trace when a given instruction is called. I usually think of kprobes as tracing Linux kernel function calls, but you can actually trace any instruction inside the kernel and inspect the registers. Weird, right?
Brendan Gregg has a kprobe script that you can use to play around with kprobes.
For example! Let’s use kprobes to spy on which files are being opened on our computer. I ran
$ sudo ./kprobe 'p:myopen do_sys_open filename=+0(%si):string'
from the examples and right away it started printing out every file that was being opened on my computer. Neat!!!
You’ll notice that the kprobes interface by itself is a little gnarly though – like, you have to know that the filename argument to do_sys_open is in the %si register and dereference that pointer and tell the kprobes system that it’s a string.
I think kprobes are useful in 3 scenarios:
- You’re tracing a system call. System calls all have corresponding kernel functions like
do_sys_open - You’re debugging some performance issue in the network stack or to do with file I/O and you understand the kernel functions that are called well enough that it’s useful for you to trace them (not impossible!!! The linux kernel is just code after all!)
- You’re a kernel developer,or you’re otherwise trying to debug a kernel bug, which happens sometimes!! (I am not a kernel developer)
Uprobes are kind of like kprobes, except that instead of instrumenting a kernel function you’re instrumenting userspace functions (like malloc). brendan gregg has a good post from 2015.
My understanding of how uprobes work is:
- You decide you want to trace the
mallocfunction in libc - You ask the linux kernel to trace malloc for you from libc
- Linux goes and finds the copy of libc that’s loaded into memory (there should be just one, shared across all processes), and changes the code for
mallocso that it’s traced - Linux reports the data back to you somehow (we’ll talk about how “asking linux” and “getting the data back somehow” works later)
This is pretty cool! One example of a thing you can do is spy on what people are typing into their bash terminals
bork@kiwi~/c/perf-tools> sudo ./bin/uprobe 'r:bash:readline +0($retval):string'
Tracing uprobe readline (r:readline /bin/bash:0x9a520 +0($retval):string). Ctrl-C to end.
            bash-10482 [002] d...  1061.417373: readline: (0x42176e <- 0x49a520) arg1="hi"
            bash-10482 [003] d...  1061.770945: readline: (0x42176e <- 0x49a520) arg1=(fault)
            bash-10717 [002] d...  1063.737625: readline: (0x42176e <- 0x49a520) arg1="hi"
            bash-10717 [002] d...  1067.091402: readline: (0x42176e <- 0x49a520) arg1="yay"
            bash-10717 [003] d...  1067.738581: readline: (0x42176e <- 0x49a520) arg1="wow"
            bash-10717 [001] d...  1165.196673: readline: (0x42176e <- 0x49a520) arg1="cool-command"
USDT stands for “Userland Statically Defined Tracing”, and “USDT probe” means the same thing as “dtrace probe” (which was surprising to me!). You might have heard of dtrace on BSD/Solaris, but you can actually also use dtrace probes on Linux, though the system is different. It’s basically a way to expose custom events. For example! Python 3 has dtrace probes, if you compile it right.
python.function.entry(str filename, str funcname, int lineno, frameptr)
This means that if you have a tool that can consume dtrace probes, (like eBPF / systemtap), and a version of Python compiled with dtrace support, you can automagically trace Python function calls. That’s really cool! (though this is a little bit of an “if” – not all Pythons are compiled with dtrace support, and the version of Python I have in Ubuntu 16.04 doesn’t seem to be)
How to tell if you have dtrace probes, from the Python docs. Basically you poke around in the binaries with readelf and look for the string “stap” in the notes.
$ readelf -S ./python | grep .note.stapsdt
[30] .note.stapsdt        NOTE         0000000000000000 00308d78
# sometimes you need to look in the .so file instead of the binary
$ readelf -S libpython3.3dm.so.1.0 | grep .note.stapsdt
[29] .note.stapsdt        NOTE         0000000000000000 00365b68
$ readelf -n ./python
If you want to read more about dtrace you can read this paper from 2004 but I’m not actually sure what the best reference is.
Tracepoints are also in the Linux kernel. (here’s an LWN article). The system was written by Mathieu Desnoyers (who’s from Montreal! :)). Basically there’s a TRACE_EVENT macro that lets you define tracepoints like this one (which has something to do with UDP… queue failures?):
TRACE_EVENT(udp_fail_queue_rcv_skb,
           TP_PROTO(int rc, struct sock *sk),
        TP_ARGS(rc, sk),
        TP_STRUCT__entry(
                __field(int, rc)
                __field(__u16, lport)
        ),
….
I don’t really understand how it works (I think it’s pretty involved) but basically tracepoints:
- Are better than kprobes because they stay more constant across kernel versions (kprobes just depend on whatever code happens to be in the kernel at that time)
- Are worse than kprobes because somebody has to write them explicitly
lttng-ust
I don’t understand LTTng super well yet but – my understanding is that all of the 4 above things (dtrace probes, kprobes, uprobes, and tracepoints) all need to go through the kernel at some point. lttng-ust is a tracing system that lets you compile tracing probes into your programs, and all of the tracing happens in userspace. This means it’s faster because you don’t have to do context switching. I’ve still used LTTng 0 times so that’s mostly all I’m going to say about that.
Mechanisms for collecting your delicious delicious data
To understand the frontend tools you use to collect & analyze tracing data, it’s important to understand the fundamental mechanisms by which tracing data gets out of the kernel and into your grubby hands. Here they are. (there are just 5! ftrace, perf_events, eBPF, systemtap, and lttng).
Let’s start with the 3 that are actually part of the core Linux kernel: ftrace, perf_events, and eBPF.
Those ./kprobe and ./uprobe scripts up there? Those both use ftrace to get data out of the kernel. Ftrace is a kind of janky interface which is a pain to use directly. Basically there’s a filesystem at /sys/kernel/debug/tracing/ that lets you get various tracing data out of the kernel.
The way you fundamentally interact with ftrace is
- Write to files in
/sys/kernel/debug/tracing/ - Read output from files in
/sys/kernel/debug/tracing/
Ftrace supports:
- Kprobes
- Tracepoints
- Uprobes
- I think that’s it.
Ftrace’s output looks like this and it’s a pain to parse and build on top of:
            bash-10482 [002] d...  1061.417373: readline: (0x42176e <- 0x49a520) arg1="hi"
            bash-10482 [003] d...  1061.770945: readline: (0x42176e <- 0x49a520) arg1=(fault)
            bash-10717 [002] d...  1063.737625: readline: (0x42176e <- 0x49a520) arg1="hi"
            bash-10717 [002] d...  1067.091402: readline: (0x42176e <- 0x49a520) arg1="yay"
            bash-10717 [003] d...  1067.738581: readline: (0x42176e <- 0x49a520) arg1="wow"
            bash-10717 [001] d...  1165.196673: readline: (0x42176e <- 0x49a520)
The second way to get data out of the kernel is with the perf_event_open system call. The way this works is:
- You call the
perf_event_opensystem call - The kernel writes events to a ring buffer in user memory, which you can read from
As far as I can tell the only thing you can read this way is tracepoints. This is what running sudo perf trace does (there’s a tracepoint for every system call)
eBPF is a VERY EXCITING WAY to get data. Here’s how it works.
- You write an “eBPF program” (often in C, or likely you use a tool that generates that program for you).
- You ask the kernel to attach that probe to a kprobe/uprobe/tracepoint/dtrace probe
- Your program writes out data to an eBPF map / ftrace / perf buffer
- You have your precious precious data!
eBPF is cool because it’s part of Linux (you don’t have to install any kernel modules) and you can define your own programs to do any fancy aggregation you want so it’s really powerful. You usually use it with the bcc frontend which we’ll talk about a bit later. It’s only available on newer kernels though (the kernel version you need depends on what data sources you want to attach your eBPF programs to)
Different eBPF features are available at different kernel versions, here’s a slide with an awesome summary:
Sysdig is a kernel module + tracing system. It lets you trace system calls and maybe some other things? I find their site kind of confusing to navigate, but I think this file contains the list of all the events sysdig supports. So it will tell you what files are being opened but not the weird internal details of what your TCP stack is doing.
I’m a little fuzzy how SystemTap works so we’re going to go from this architecture document
- You decide you want to trace a kprobe
- You write a “systemtap program” & compile it into a kernel module
- That kernel module, when inserted, creates kprobes that call code from your kernel module when triggered (it calls
register_kprobe) - You kernel modules prints output to userspace (using relayfs or something)
SystemTap supports:
- tracepoints
- kprobes
- uprobes
- USDT
Basically lots of things! There are some more useful words about systemtap in choosing a linux tracer
LTTng (linux tracing: the next generation) is from Montreal (a lab at ecole polytechnique)!! which makes me super happy (montreal!!). I saw an AMAZING demo of tool called trace compass the other day that reads data that comes from LTTng. Basically it was able to show all the sched_switch transitions between programs and system calls when running tar -xzf somefile.tar.gz, and you could really see exactly what was happening in a super clear way.
The downside of LTTng (like SystemTap) is that you have to install a kernel module for the kernel parts to work. With lttng-ust everything happens in userspace and there’s no kernel module needed.
Frontends
Okay! Time for frontends! I’m going to categorize them by mechanism (how the data gets out of the kernel) to make it easier
The only frontend here is perf, it’s simple.
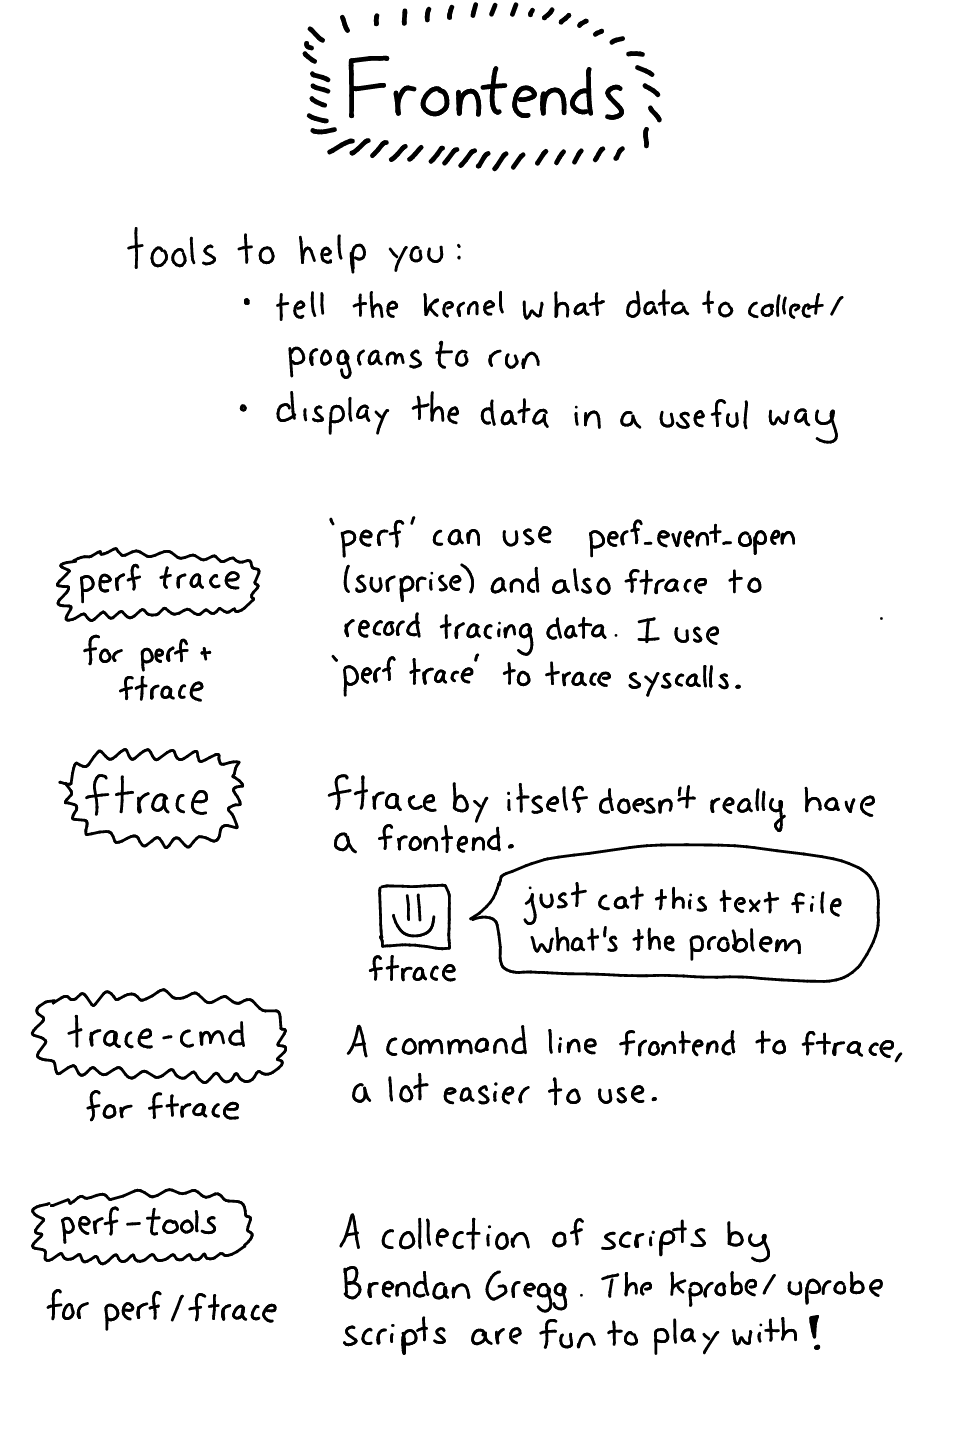
perf trace will trace system calls for you, fast. That’s great and I love it. perf trace is the only one of these I actually use day to day right now. (the ftrace stuff is more powerful and also more confusing / difficult to use)
Ftrace is a pain to use on its own and so there are various frontend tools to help you. I haven’t found the best thing to use yet but here are some starting points:
- trace-cmd is a frontend for ftrace, you can use it to collect and display ftrace data. I wrote about it a bit in this blog post and there’s an article on LWN about it
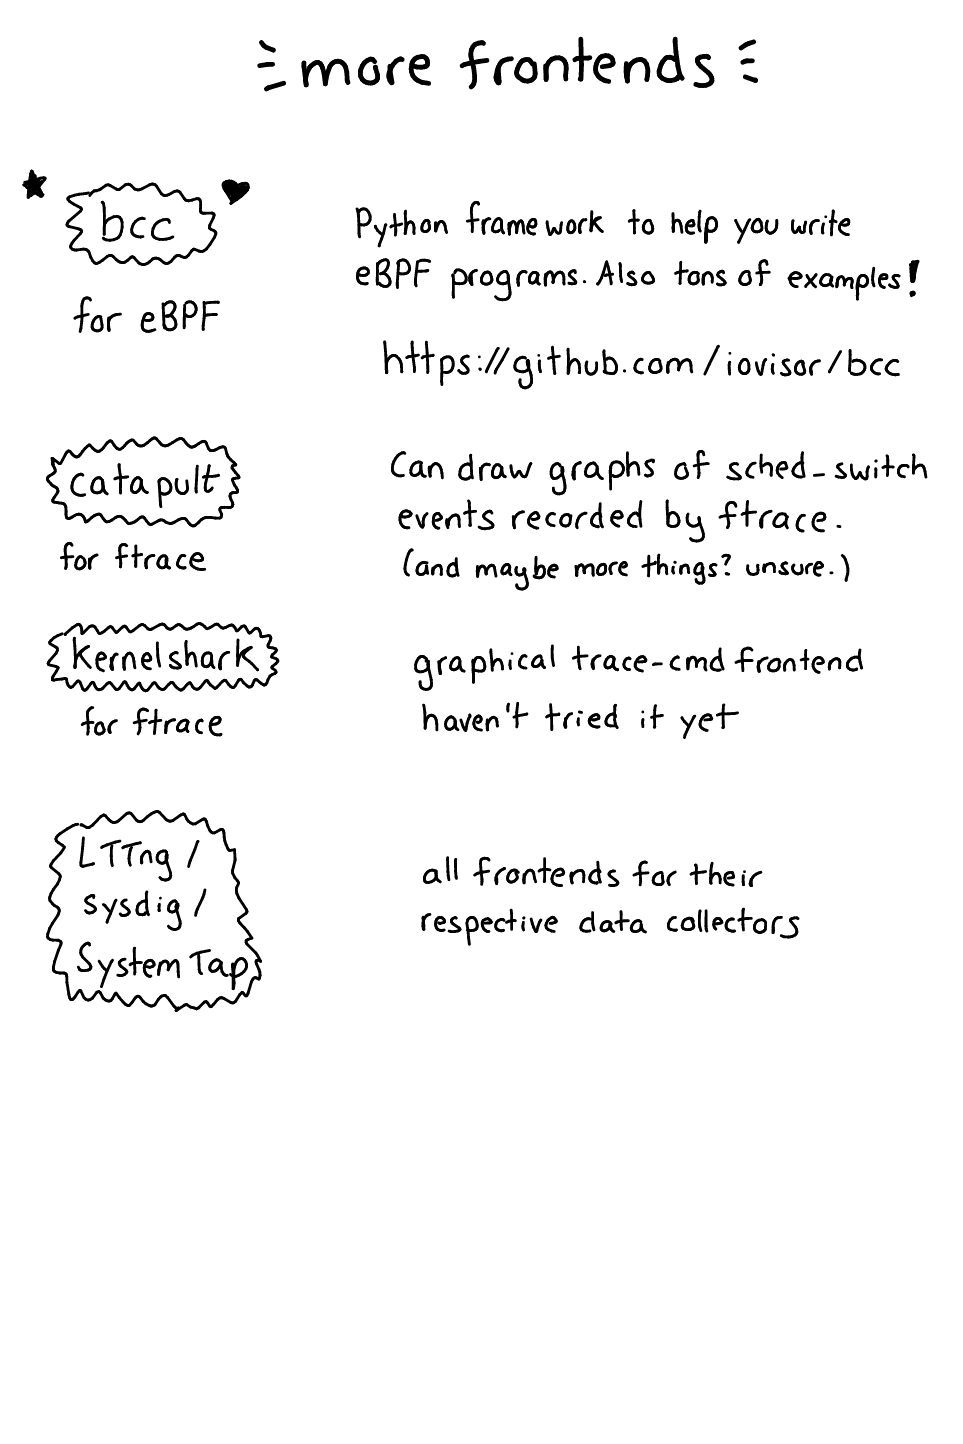
- Catapult lets you analyze ftrace output. It’s for Android / chrome performance originally but you can also just analyze ftrace. So far the only thing I’ve gotten it to do is graph
sched_switchevents so you know which processes were running at what time exactly, and which CPU they were on. Which is pretty cool but I don’t really have a use for yet? - kernelshark consumes ftrace output but I haven’t tried it yet
- The perf command line tool is a perf frontend and (confusingly) also a frontend for some ftrace functionality (see
perf ftrace)
The only I know of is the bcc framework: https://github.com/iovisor/bcc. It lets you write eBPF programs, it’ll insert them into the kernel for you, and it’ll help you get the data out of the kernel so you can process it with a Python script. It’s pretty easy to get started with.
If you’re curious about the relationship between eBPF and the BPF you use in tcpdump I wrote a post about eBPF & its relationship with BPF for packet filtering the other day. I think it might be easiest though to think of them as unrelated because eBPF is so much more powerful.
bcc is a bit weird because you write a C program inside a Python program but there are a lot of examples. Kamal and I wrote a program with bcc the other day for the first time and it was pretty easy.
LTTng & SystemTap both have their own sets of tools that I don’t really understand. THAT SAID – there’s this cool graphical tool called Trace Compass that seems really powerful. It consumes a trace format called CTF (“common trace format”) that LTTng emits.
what tracing tool should I use though
Here’s kind of how I think about it right now (though you should note that I only just figured out how all this stuff fits together very recently so I’m not an expert):
- if you’re mostly interested in computers running kernels > linux 4.9, probably just learn about eBPF
perf traceis good, it will trace system calls with low overhead and it’s super simple, there’s not much to learn. A+.- For everything else, they’re, well, an investment, they take time to get used to.
- I think playing with kprobes is a good idea (via eBPF/ftrace/systemtap/lttng/whatever, for me right now ftrace is easiest). Being able to know what’s going on in the kernel is a good superpower.
- eBPF is only available in kernel versions above 4.4, and some features only above 4.7. I think it makes sense to invest in learning it but on older systems it won’t help you out yet
- ftrace is kind of a huge pain, I think it would be worth it for me if I could find a good frontend tool but I haven’t managed it yet.
I hope this helped!
I’m really excited that now I (mostly) understand how all these pieces fit together, I am literally typing some of this post at a free show at the jazz festival and listening to blues and having a fun time.
Now that I know how everything fits together, I think I’ll have a much easier time navigating the landscape of tracing frontends!
Brendan Gregg’s awesome blog discusses a ton of these topics in a lot of detail – if you’re interested in hearing about improvements in the Linux tracing ecosystem as they happen (it’s always changing!), that’s the best place to subscribe.
thanks to Annie Cherkaev, Harold Treen, Iain McCoy, and David Turner for reading a draft of this.
