A swiss army knife of debugging tools: talk & transcript
Yesterday I gave a talk at Strange Loop. I’ll try to write more about the conference and my favorite things about it later, but for now here’s the talk I gave.
video
transcript
I mean “transcript” in a very loose sense here – this is pretty approximate. I wrote it all down without watching the actual talk I gave at all.

Hi! I'm Julia. I work at Stripe and today I'm going to tell you about some of my favorite debugging tools!

an alternate title slide!

At Strange Loop we often talk about programming languages! This talk isn't about programming languages at all. Instead, we're going to talk about debugging tools that you can use to debug programs in any programming language.
When Haskell does networking, it uses TCP. Python uses TCP! Fortran! So if we debug programs using networking tools, we can debug programs in any language.

When I log into a computer, sometimes something has gone TERRIBLY WRONG. And in these situations, sometimes you can feel helpless! We're going to talk about tools you can use to figure out what has happened.

I used to think to debug things, I had to be really really smart. I thought I had to stare at the code, and think really hard, and magically intuit what the bug was.
It turns out that this isn't true at all! If you have the right tools, fixing bugs can be *really easy*. Sometimes with just a little more information, you can figure out what's happening without being a genius at all.

The last thing I want to encourage you to do before we start this talk is -- we're going to be talking about a lot of systems tools. It's easy to think "oh, this is operating systems, it's too hard."
But if you're not scared, you can usually figure out almost anything!
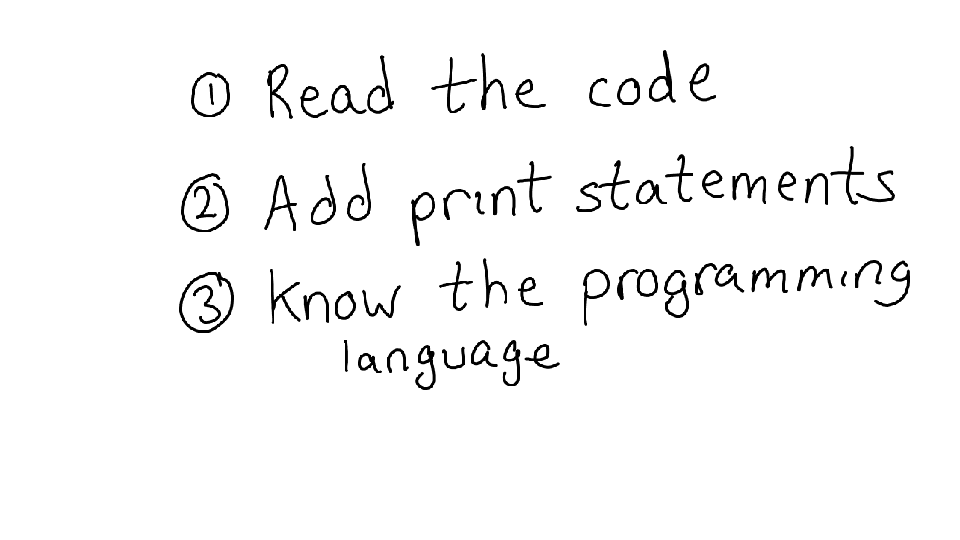
So, when we normally debug, we usually read the code, add print statements, and you should probably know the programing language of the program you're writing, right?

Nope! This isn't true at all. You can totally debug programs without having their source code or even knowing what language they're written in at all. That's what we're going to do in this talk.

Here are some of the tools we're going to discuss in this talk! strace, ngrep, wireshark, etc.
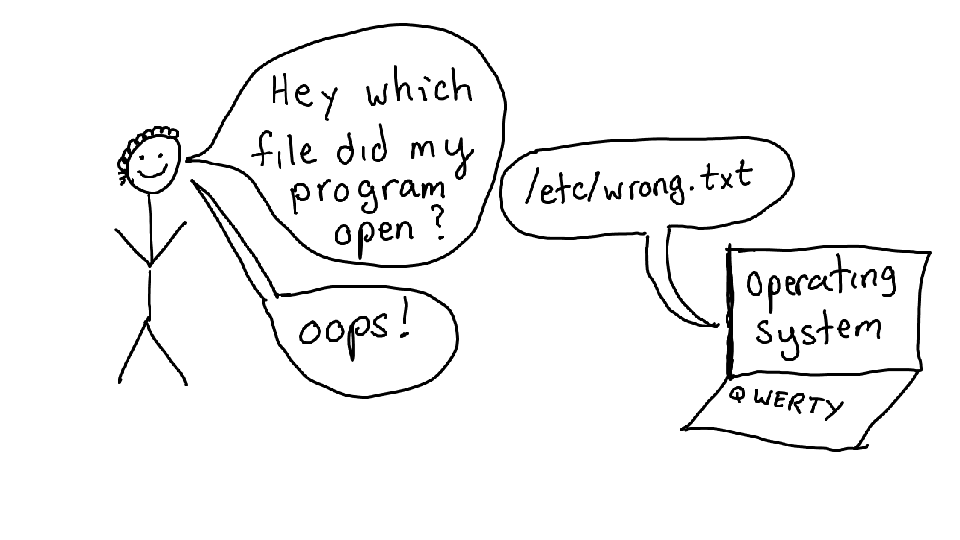
And the way that most of these work is like the following -- you have a question ("what file did my program open"), you use a tool to interrogate your operating system about what the program is doing, and hopefully the answer you get back helps you fix your problem.

I'm going to explain how these tools work through a series of mysteries (the case of the missing configuration file! the case of the slow program! the case of the French website!) and then I'm going to go a little more in depth into two more tools -- perf and tcpdump.


Who's written a configuration file and been confused about why it didn't work and realized they were editing the WRONG FILE? Yeah, me too. This is really annoying!
Normally to figure out what the right configuration file is for your program, you might read the documentation or as a coworker. But what if the documentation is wrong, or your coworker doesn't know? What do you do if you want to be really sure?
A really classic example of this is .bashrc vs .bash_profile -- when you start bash, which configuration file does it use? How can you tell? I actually know this through experience, but what if I didn't?

To figure this out, we're going to use my absolute favorite program! STRACE. strace traces system calls.
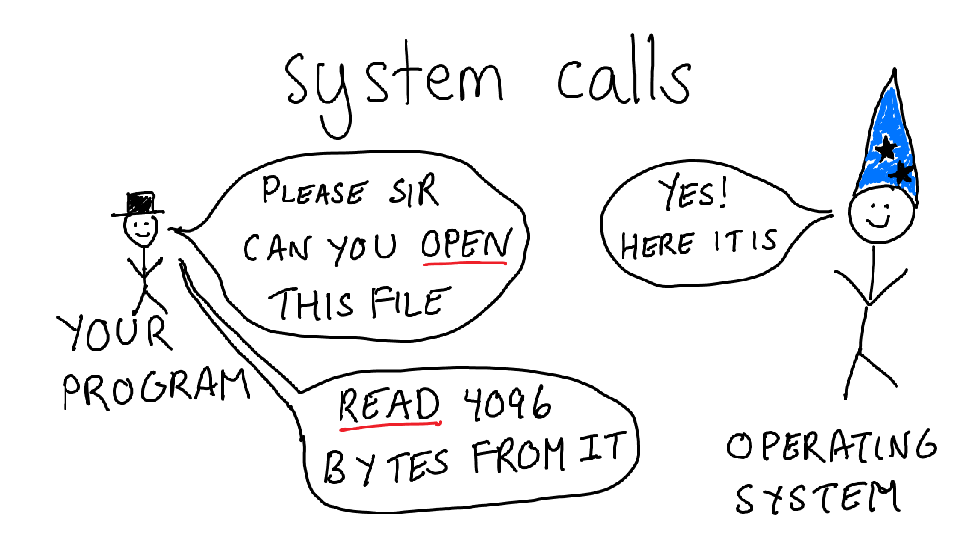
Let's talk about what a system call is. Your program does not itself know how to open files. To open a file, you need to understand how your hard drive works, and what filesystem is on that hard drive, and all kinds of complicated things.
Instead, your program asks the operating system to open a file. One that file is open, it can ask the OS to read and write to the file. The words I've underlined in red (open and read) are called **system calls**.
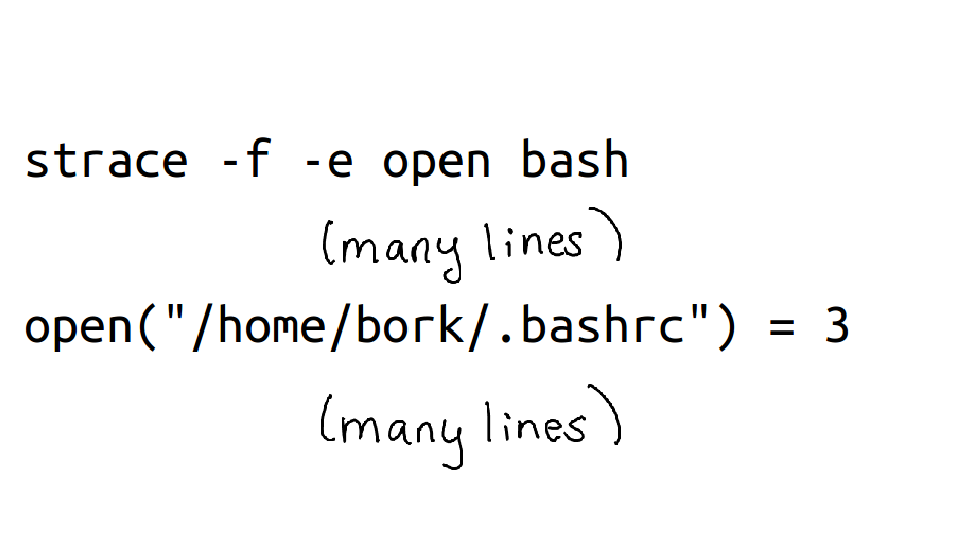
strace will tell you every system call a program is running. To run strace on a program, you just say "strace" before it.
When I run strace on bash and ask it to look at just "open" system calls, I can see that it's opening .bashrc! Great! We win.

So we answered our question! Awesome.

Before we move on, I want to show you a quick demo of what it actually looks like to use strace. (do demo>
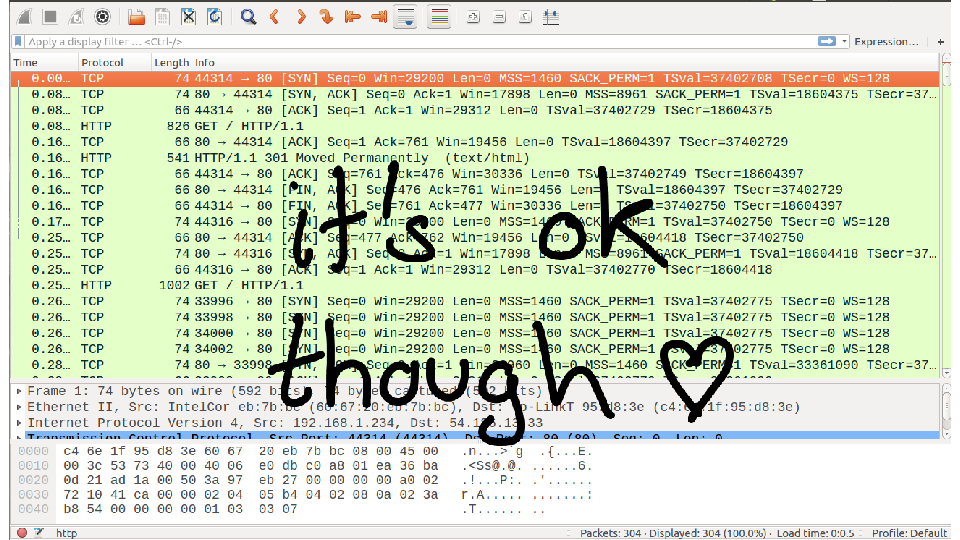
What you see is that strace prints approximately a billion lines of output, and you very very likely don't know what they all mean. This is okay!
When I use strace, I ignore practically everything, and just grep to find the one thing I'm interested in. This makes it a lot easier to understand :)

An extremely important thing to know about strace is that if you run it on a program, it can make that program run up to 50x slower, depending on how many system calls that program uses.
So don't run it on your production database.
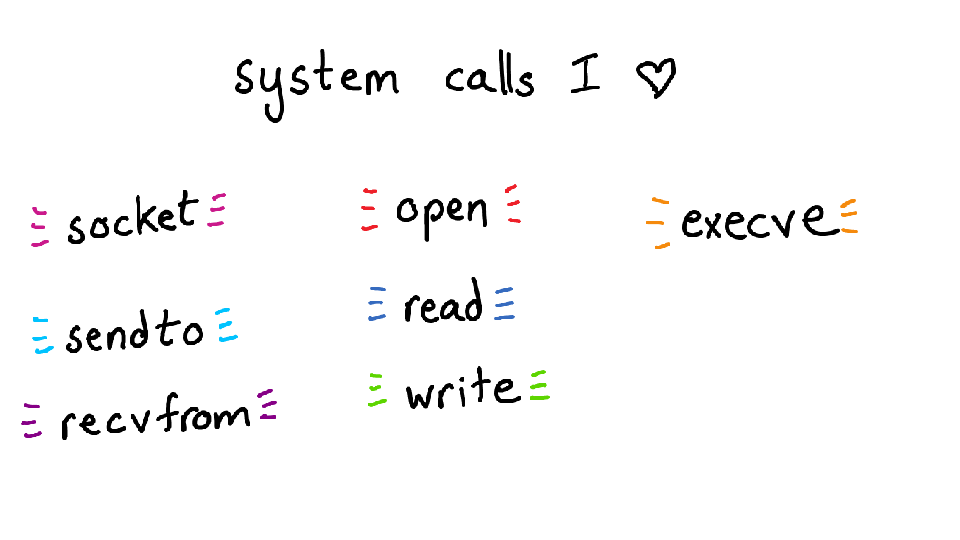
Here are some of my favorite system calls! There are system calls for communicating over the network (what computers is my program talking to?), for reading and writing files, and executing programs.
execve is one of my favorites because -- sometimes I write scripts that run a bunch of other programs. If the script is doing the wrong thing, it can be really annoying to debug! Reading code is a lot of work.
But if you use strace, you can just see the commands that got run really quickly, see what is wrong, and then go back and track it down in your program to fix it.
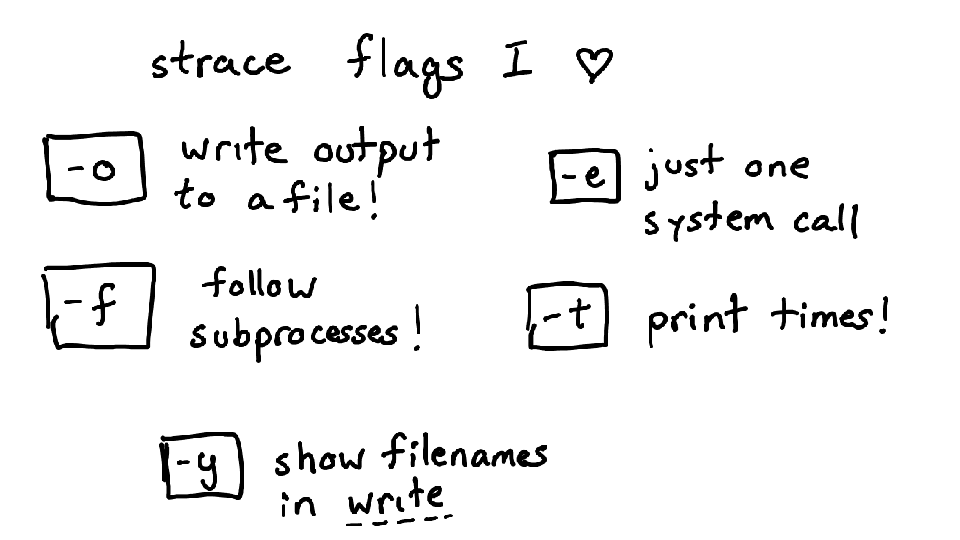
Some really important command line flags to strace! -f lets you strace the process and every subprocess it creates. I basically always run strace with -f.
-y is an amazing flag in new versions of strace that shows you the filename of the file you're reading to and writing from. (instead of just the file descriptor)

I was so excited when I learned about strace, and I couldn't believe that I'd been programming for 9 years without knowing about it. So I wrote a zine about my love for strace. You can find it at https://wizardzines.com/zines/strace

Okay, so I told you that strace is slow! What if you want something that is not slow? If you're on a Linux kernel version above 4.4 or so, you're in luck. There's a set of tools you can download from https://github.com/iovisor/bcc, which include something called "opensnoop".
(do opensnoop demo). Basically opensnoop can tell you which files your programs are opening, but without slowing down your programs! amazing!
In particular Ubuntu 16.04 is new enough for this tool.

Opensnoop (and the other scripts in that repo I linked to) work using eBPF. Brendan Gregg has been writing a lot about eBPF for a while. It seems super interesting.

Okay, next mystery!
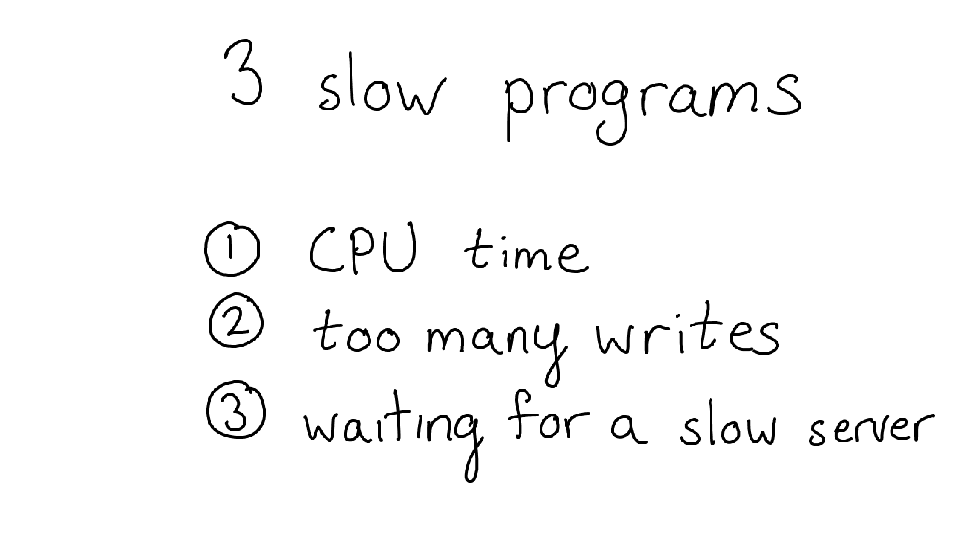
Here I'm going to discuss 3 slow programs, which are all slow for different reasons. We're going to figure out why they're all slow, without reading the source code or anything. All the programs are written in Python.
They're slow because of CPU time, writing too much to disk, and because of waiting for a reply from a network connection.

Here's the first one!
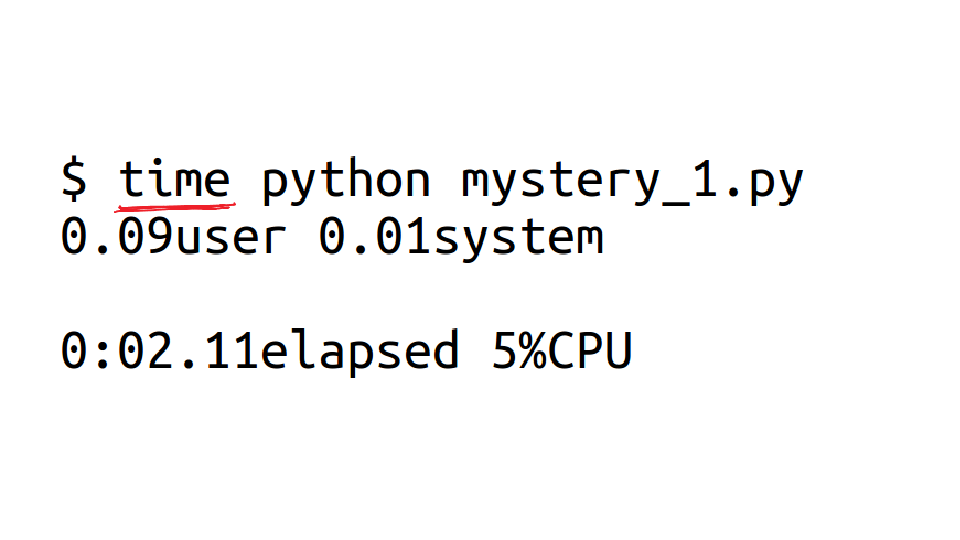
I'm going to run `time` on all these programs. time is a nice program! It tells you how long the program took (2 seconds), but that's not all!
It also breaks down how the time was spent. This program spent 5% of its time on the CPU! So for the remaining 95% of the time it was waiting.

The program could have been waiting for a lot of different things! Network, disk, just because it decided to hang out and wait?

Luckily this is pretty easy to find out! We can peer into the Linux kernel's soul and figure out what it was doing when the program was waiting.

For any program, we can take the program's PID (in this case 31728), and ask what the Linux kernel is doing for that program right now.
We get a call stack starting with the system call and ending up with the current function. Awesome!
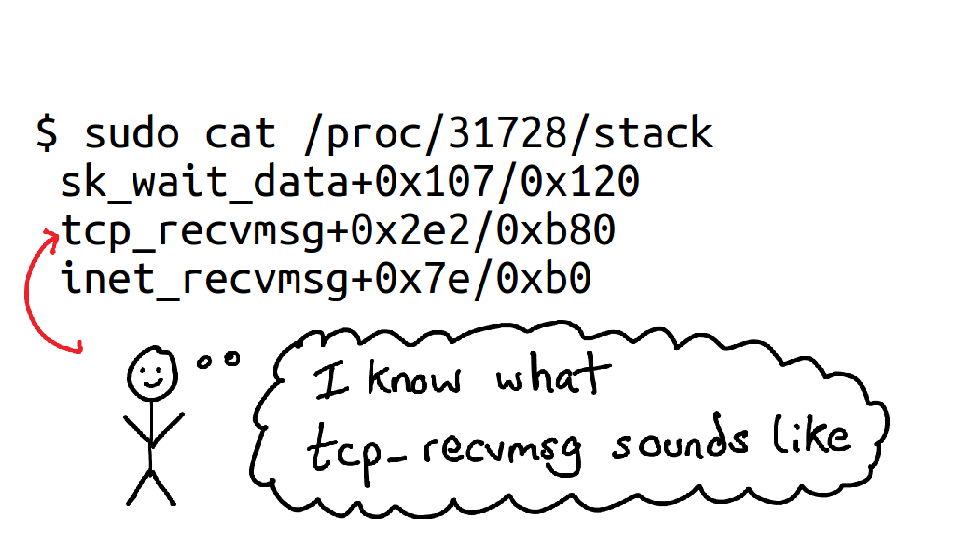
To help you see what's going on, I deleted almost everything. I know what tcp_recvmsg means! It means it's waiting to receive a message on a TCP connection!
That's networking! That was really easy! We don't need to be kernel debugging wizards to figure out what's going on.

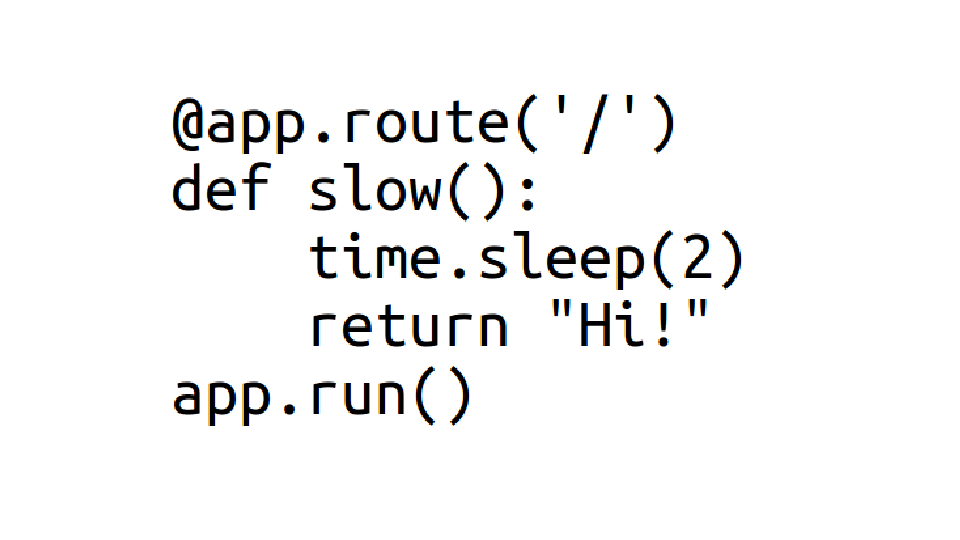
This was the actual program that the server was running -- you can see that it sleeps for 2 seconds, and then returns a response of "hi!".
So it's obvious why the program was slow :) But you can apply the exact same technique to much more complicated programs.

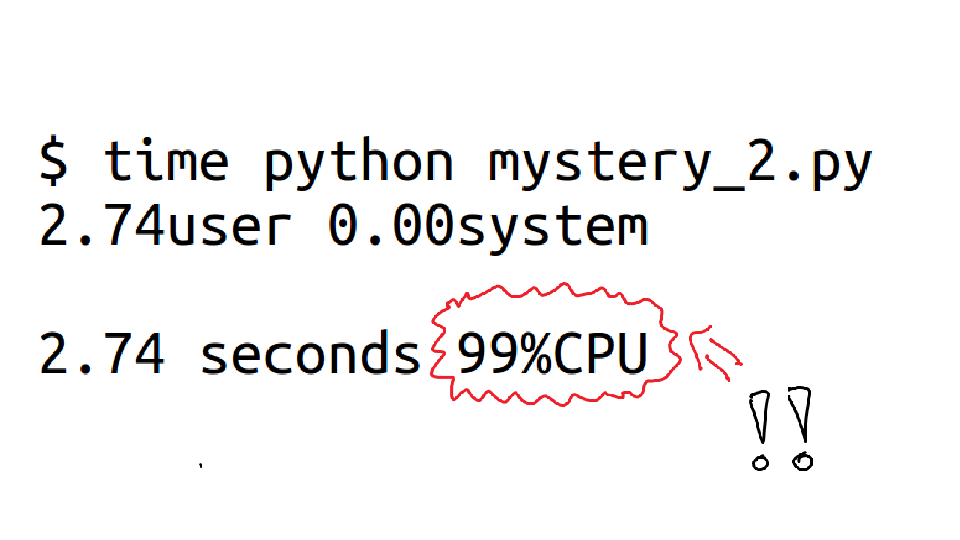
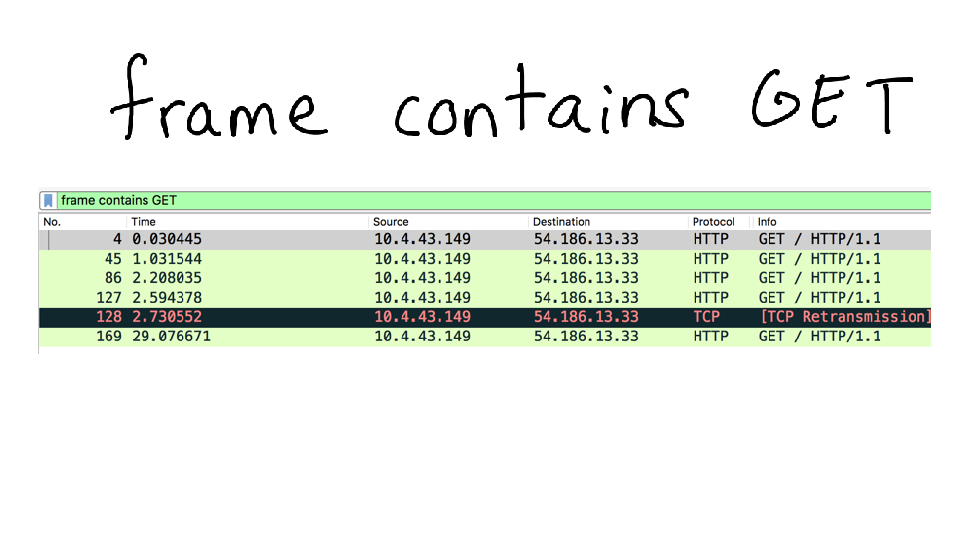
When we run `time` on our next program, we see something really interesting right away! It's spending 99% of its time just using the CPU.

At this point we're actually done -- since this is a Python program, the easiest thing to do is probably just to run a Python profiler to find out what it was doing.
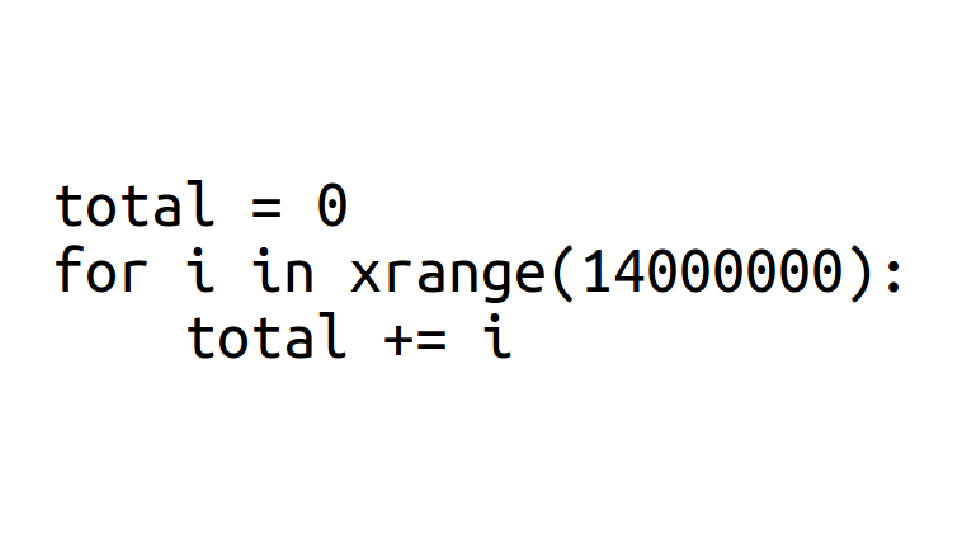
And what it was actually was adding up 14 million numbers. You can decide whether you think 2.74 seconds is how long you think it should take to add up 14 million numbers or not :)
(I made a whole game about this called computers are fast )

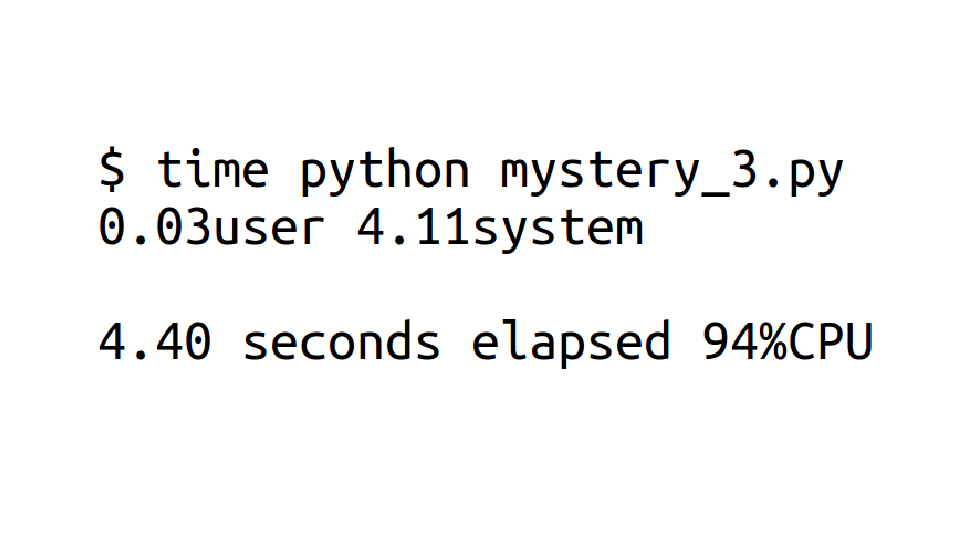
Okay, this one is spending 94% of its time on the CPU. So this is basically the same as before, right? Nope!
You'll notice that there are two kinds of CPU your program can use: user CPU and system CPU. This one is spending most of its time on CPU, but CPU in the kernel! So your program is still spending most of its time waiting.

If you have a program that's waiting, a nice way to try to figure out what's going on is to use dstat
dstat is a nice little program that prints our how much network, disk, and CPU your program is using

Here I do a demo where I run a program (python mystery_3.py), and run `dstat` while the program is running.
dstat is shows that while our program is running, 300MB/s get written to disk. When the program stops, the disk writes stop. Interesting!

So we understand that something's going on with writes, but why is it using all this CPU? Surely disk writes don't use that much CPU?

Who's used top? (everyone) htop? (a few less people) perf top? (almost nobody)

So, top tells you which one of your programs is using all your CPU. That's great.
But it doesn't tell you which *functions* your programs are running. `perf top` does, though! Let's see what that looks like.

I run `python mystery_3.py` again, and I quickly switch to another terminal tab and run `perf top`. perf top shows a bunch of functions and how much CPU time each one is using.
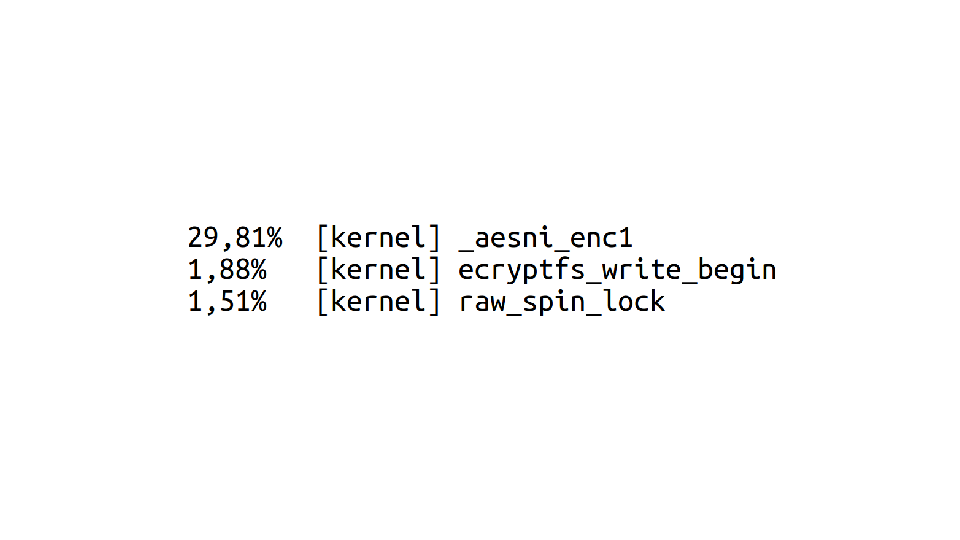
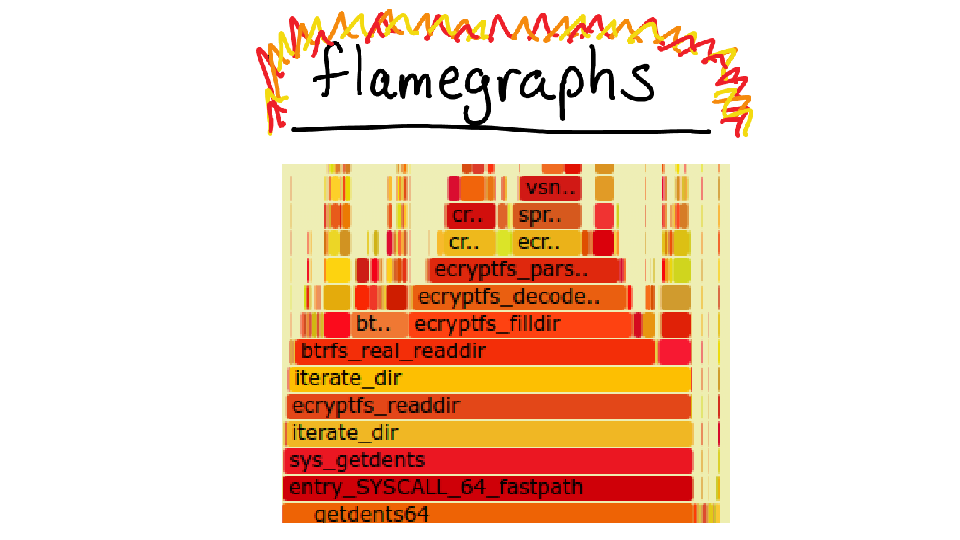
There was a lot to look at one the screen, so let's zoom in. The top function is something called `_aesni_enc1`. What does AES tell us? ENCRYPTION! That's right!
So it turns out that this program is writing files to disk, and specifically it's writing to my home directory. But my home directory is encrypted! So it needs to spend a bunch of extra time encrypting all the data, and that's what all the CPU time is about. Awesome.
So we've solved our mystery!
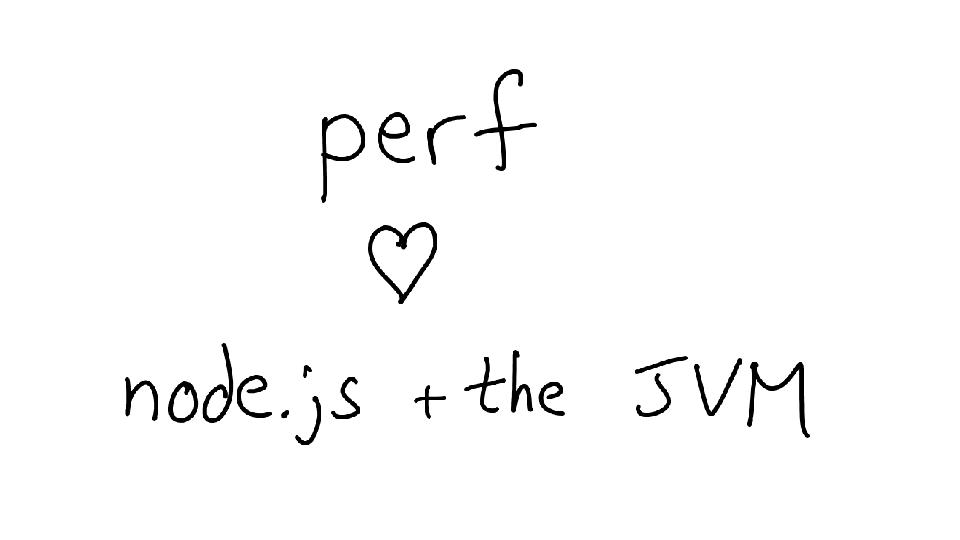
One really awesome thing about perf is -- normally perf only tells you about which *C functions* are running on your computer. But you might want to know about which functions in your programming language are running on your computer! In Java, you can use perf-map-agent to get perf to tell you what Java functions are running on your computer!
And you can do the same thing with node.js.

Our last performance program we're going to look at is the case of the French website.
I live in Montreal, and it's a bilingual city, so when you open a city website, it might show up in either French or English. You never know! What determines that?
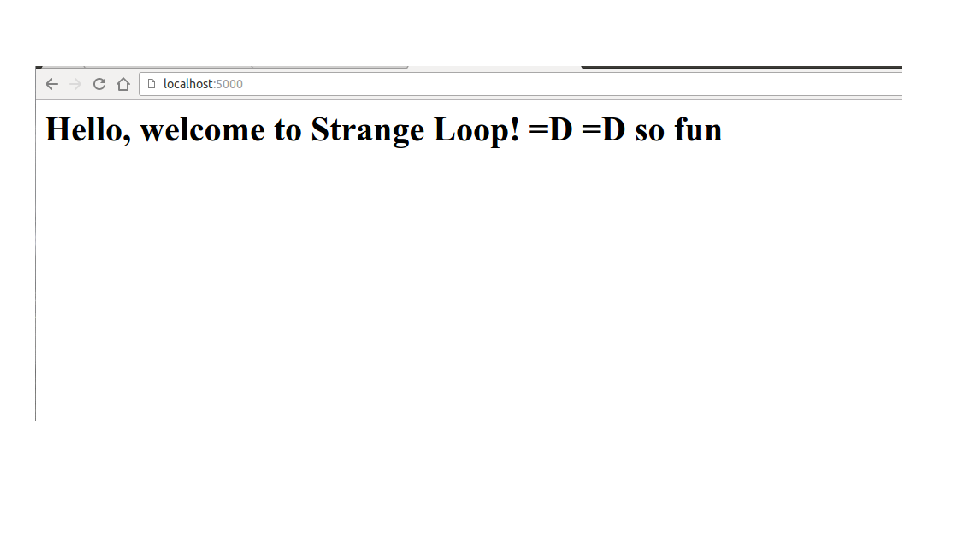
This is a website I made for this conference. It just says "hello! welcome to strange loop!" Great.

But when I get the very same website from my terminal, it replies in French, not in English! What's going on!

Most of you probably use grep, which lets you search text files. ngrep is a program that lets you search your network traffic!
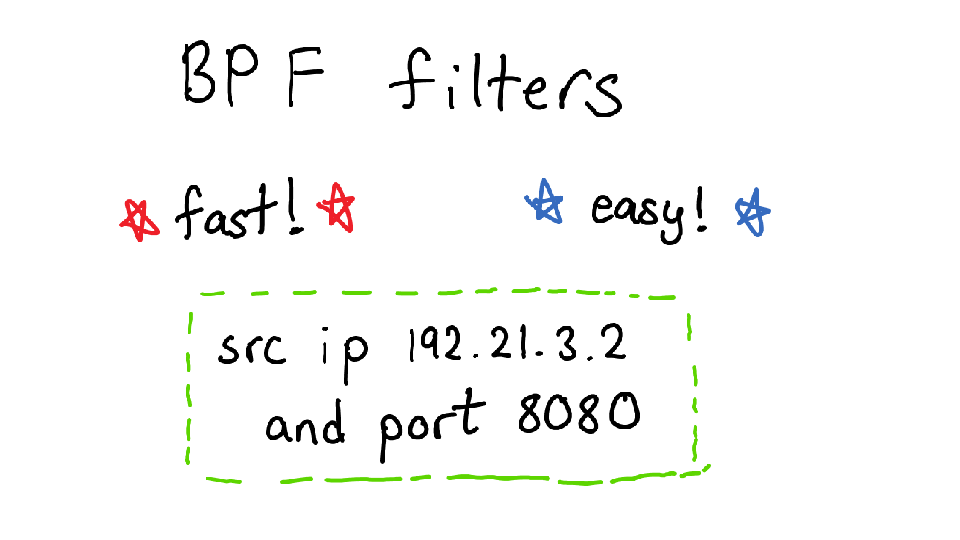
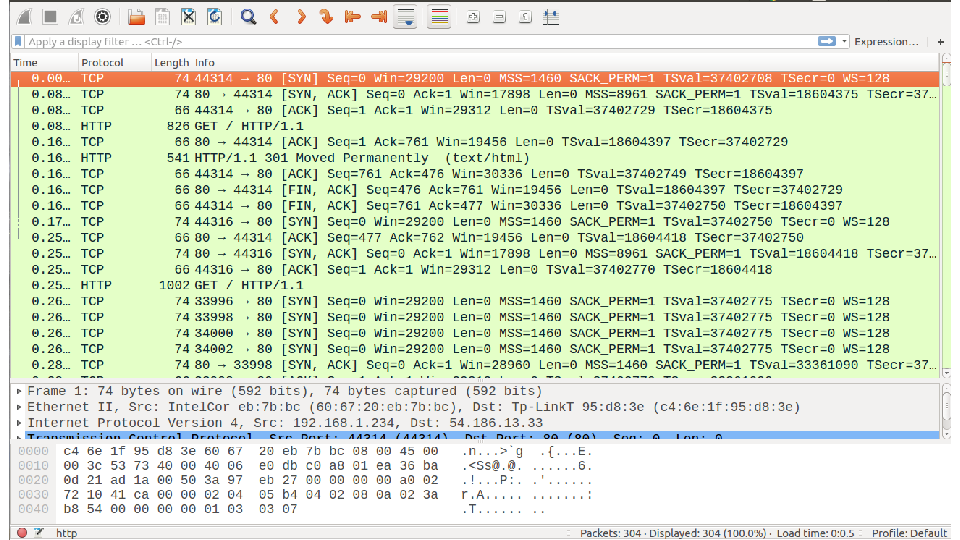
Here I do a demo where I use ngrep to show all TCP packets on localhost. We see that with curl, there's a very very simple HTTP request, but Google Chrome has a much longer request and a lot more to share with the server. In particular, the request has the string "Accept-Language: en-US" in it. When we add that header to our curl request, we get a response in English! Awesome.
Computer programs aren’t always deterministic, but they’re always logical. If you’re seeing a difference where you think there shouldn’t be any, there’s always a reason. Looking at the inputs and outputs to your programs can help you figure out what’s going on, and network traffic is a really nice place to do that.

Okay, so this is a totally new section of the top.
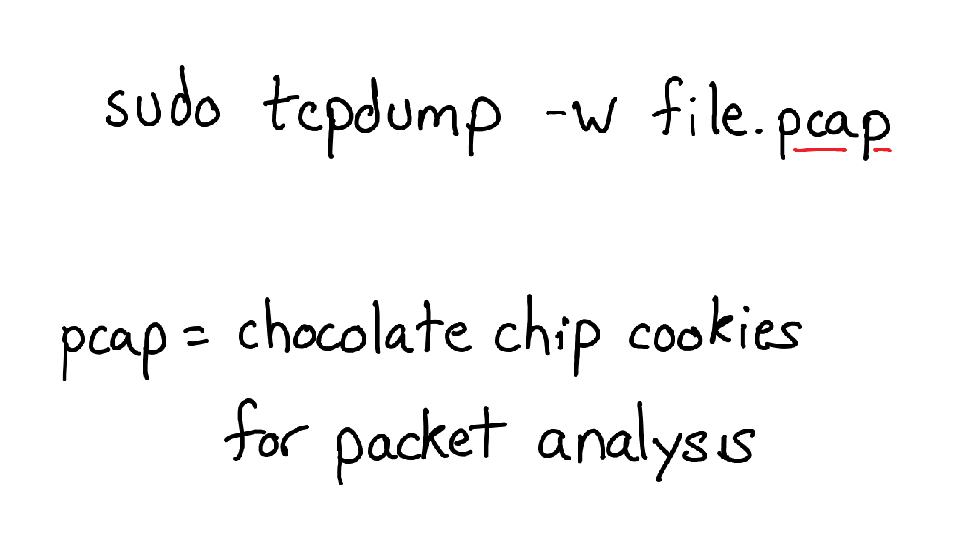
Here we're going to talk about two of my favorite things: perf and tcpdump.

perf is a profiling tool for Linux that a lot of people don't know about, mostly because it's really sparsely documented. My goal today is to change that a little bit.
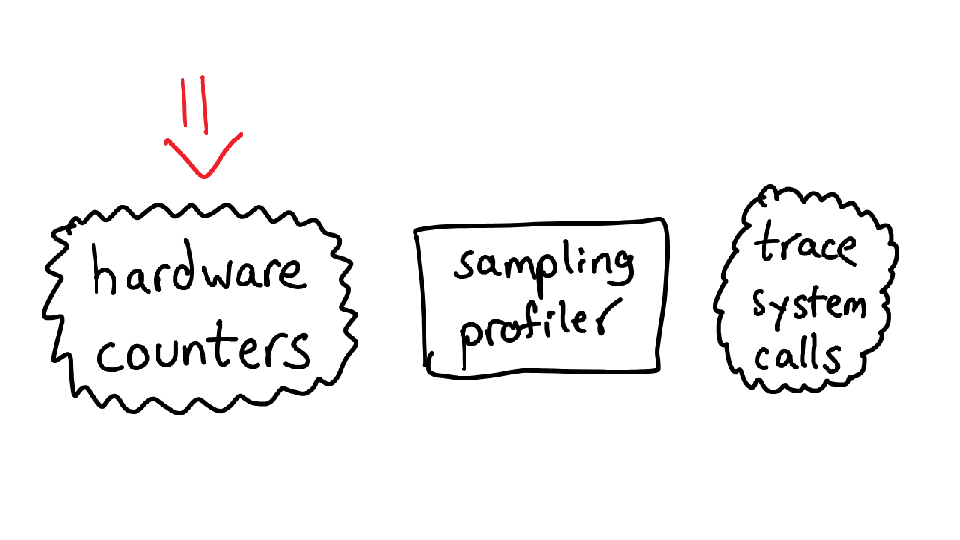
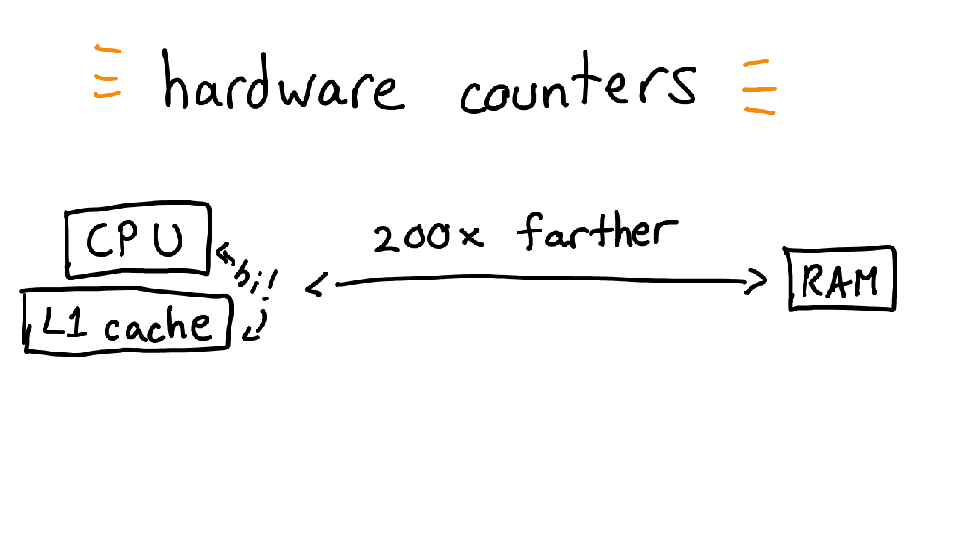
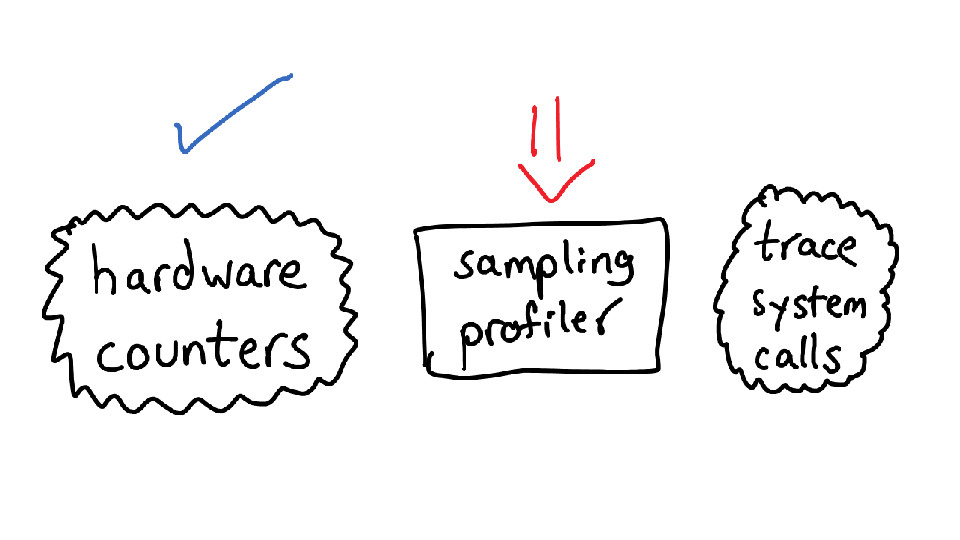
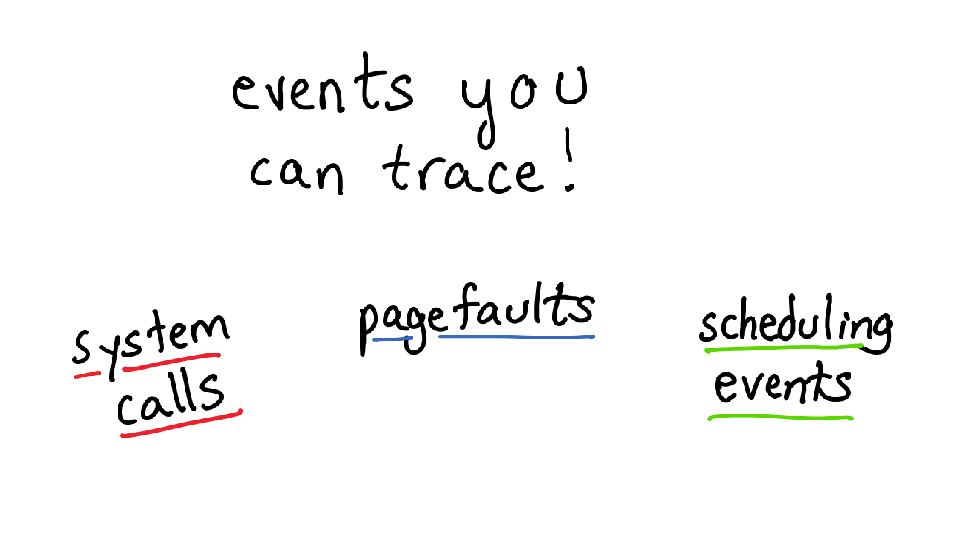
One really confusing thing about perf is that it actually has 3 almost totally unrelated tools in them: it can tell you about your hardware counters, do sampling profiling for CPU, and trace events. I'm going to talk about all these 3 things separately.
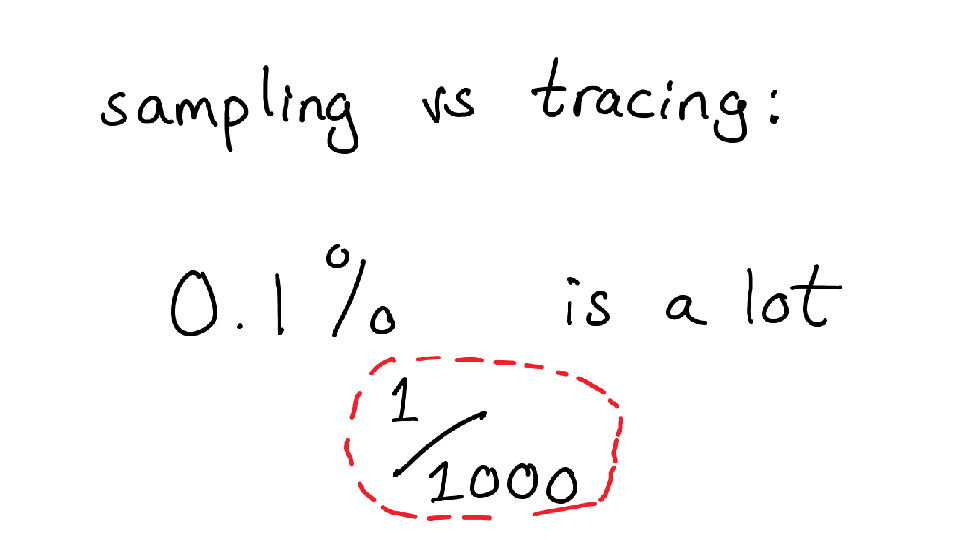
Before we move on, I want to talk about sampling vs tracing for a little bit. In a sampling profiler, you look at a small percentage of what’s going on in your program (what’s the stack trace now? how about now?), and then use that information to generalize about what your program is doing.
This is great because it reduces overhead, and usually gives you a good idea of what your program is doing.
But what happens if you have an error that happens infrequently? like 1 in 1000 times. You might think this is not a big deal, and in fact for a lot of people that might not be a big deal.
But I write programs that do things millions or billions of times, and I want
those things to be really highly reliable, so even relatively rare events are
important to me. So I love tracing tools and log files that can tell me
everything about when a certain function is called. This makes it a lot easier to debug than just having a general statistical distribution!
This is a great post about tracing tools by Dan Luu.