Why I love log files
Dan Luu wrote a fantastic blog post recently on the limitations of sampling profilers & tracing tools from the future, which you should totally read. I’m pretty into having conversations with people via blogging, so this is my much more pedestrian and less futuristic response to that post.
tracing vs profiling
One of the biggest takeaways from Dan’s post for me is:
Sampling profilers, the most common performance debugging tool, are notoriously bad at debugging problems caused by tail latency because they aggregate events into averages. But tail latency is, by definition, not average.
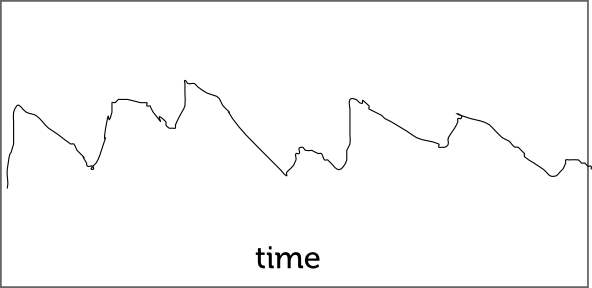
I learned this recently at work! I had a Thing that was slow. And I was staring at a dashboard with all kinds of graphs that looked like this:

This was maybe a graph of 95th percentile latency or something. Whatever. It wasn’t helping. None of the spikes in the graphs had anything to do with my slow thing. Then I asked Nelson for advice and he was basically like “dude, look at the logs!”.
The basic rationale for this is exactly what Dan says – if you have 1000 events that were unusually slow, they probably failed because of a relatively uncommon event. And uncommon events do not always show up in graphs. But know where they show up? LOG FILES. WHICH ARE THE BEST. As long as you’ve put in enough print statements.
log files: total instant success
So, back to debugging my Thing. I stopped trying to look at graphs, took Nelson’s advice and looked at the log files for the 10 slowest requests.
The logs were all like
00:00:01.000 do thing 1
00:00:01.012 do thing 2
00:00:01.032 do thing 3
00:00:01.045 do thing 4
00:00:01.056 do thing 5
00:00:02.158 do thing 6
00:00:02.160 do thing 7
In this log file, obviously thing 5 is the problem! It took like a second before getting to thing 6! What the hell, thing 5.
I’ve gotten a little more into debugging performance problems, and every time I do it, I find that
- graphs are a great way to get an overall general picture of the system (oh, the error rate suddenly and permanently increased by 2x on March 13 at 3pm?)
- graphs are also great for seeing correlations (every time we deploy code our CPU usage spikes and we have timeouts?) (but remember: CORRELATION IS NOT CAUSATION GUYS. NEVER.)
- logs are amazing for digging into short spikes of timeouts or slow requests. Often I’ll look at the logs for a few requests, they’ll all exhibit the same behavior, and I’ll have a much clearer understanding of what happened there.
That’s how I learned that logging a bunch of events (“do thing 1”) at a few well-chosen points in your code can be pretty useful, if log files are the only way you have to trace requests.
a very small digression on Splunk
Splunk is a tool that ingests your logs. It costs money and they are definitely not paying me but it is AMAZING WIZARD MAGIC.
Today I was talking about performance with a coworker and then we used Splunk to parse the nginx server logs, extract all the request times, and draw the median and 95th percentiles every hour. That’s like totally trivial with Splunk.
magical tracing tools are like log files!
I think it’s cool that these performance tools from the future that Dan describes are basically like.. magical wizard log files. And they’re great for the same reason that log files are great. Because they are both tracing tools and tracing is important!
Zipkin is a tool that serves a similar purpose, somewhere in between a bunch of print statements and the high performance instrumentation tools Dan is describing. It’s based on Dapper, a distributed tracing framework at Google. I don’t know what other tracing tools exist, though! Let me know?