Profiler week 2: support for 1.9.3 -> 2.5.0, and line numbers!
Hello! Week 2 of profiler writing is over! In week 2, I:
- added support for Ruby 1.9.x and 2.5.0!! This means I can support every ruby version from 1.9.1 to 2.5.0 which I think is basically every Ruby version anyone will reasonably use!!
- added support for getting the line number that the interpreter is currently running (so useful!)
- did a lot of refactoring to improve error handling & reporting. (for example I now have a
ProcessEndedErrorto check if I failed to get a stack trace because the process). I started using thefailurecrate which is great so far. - added “support” for calling into C extensions (by which I mean: the profiler doesn’t crash, it just ignores all calls into C extensions)
- refactored my bindgen-generated ruby bindings out into a separate crate (which)
- did some investigations into whether I should pause the Ruby process I’m profiling with ptrace
The most exciting update from last week is – I profiled Rubocop, and it worked!!!!! Rubocop is a popular linter/static analysis tool for Ruby. I mostly just picked it because it’s a standalone program and it makes a lot of function calls. It was really fun & motivating to see it working!
Here are two graphs I generated by profiling Rubocop! (I generated these basically by running
./path/to/profiler --file stacks.txt rubocop and then using brendan gregg’s flamegraph tool on the
output stacks.txt)
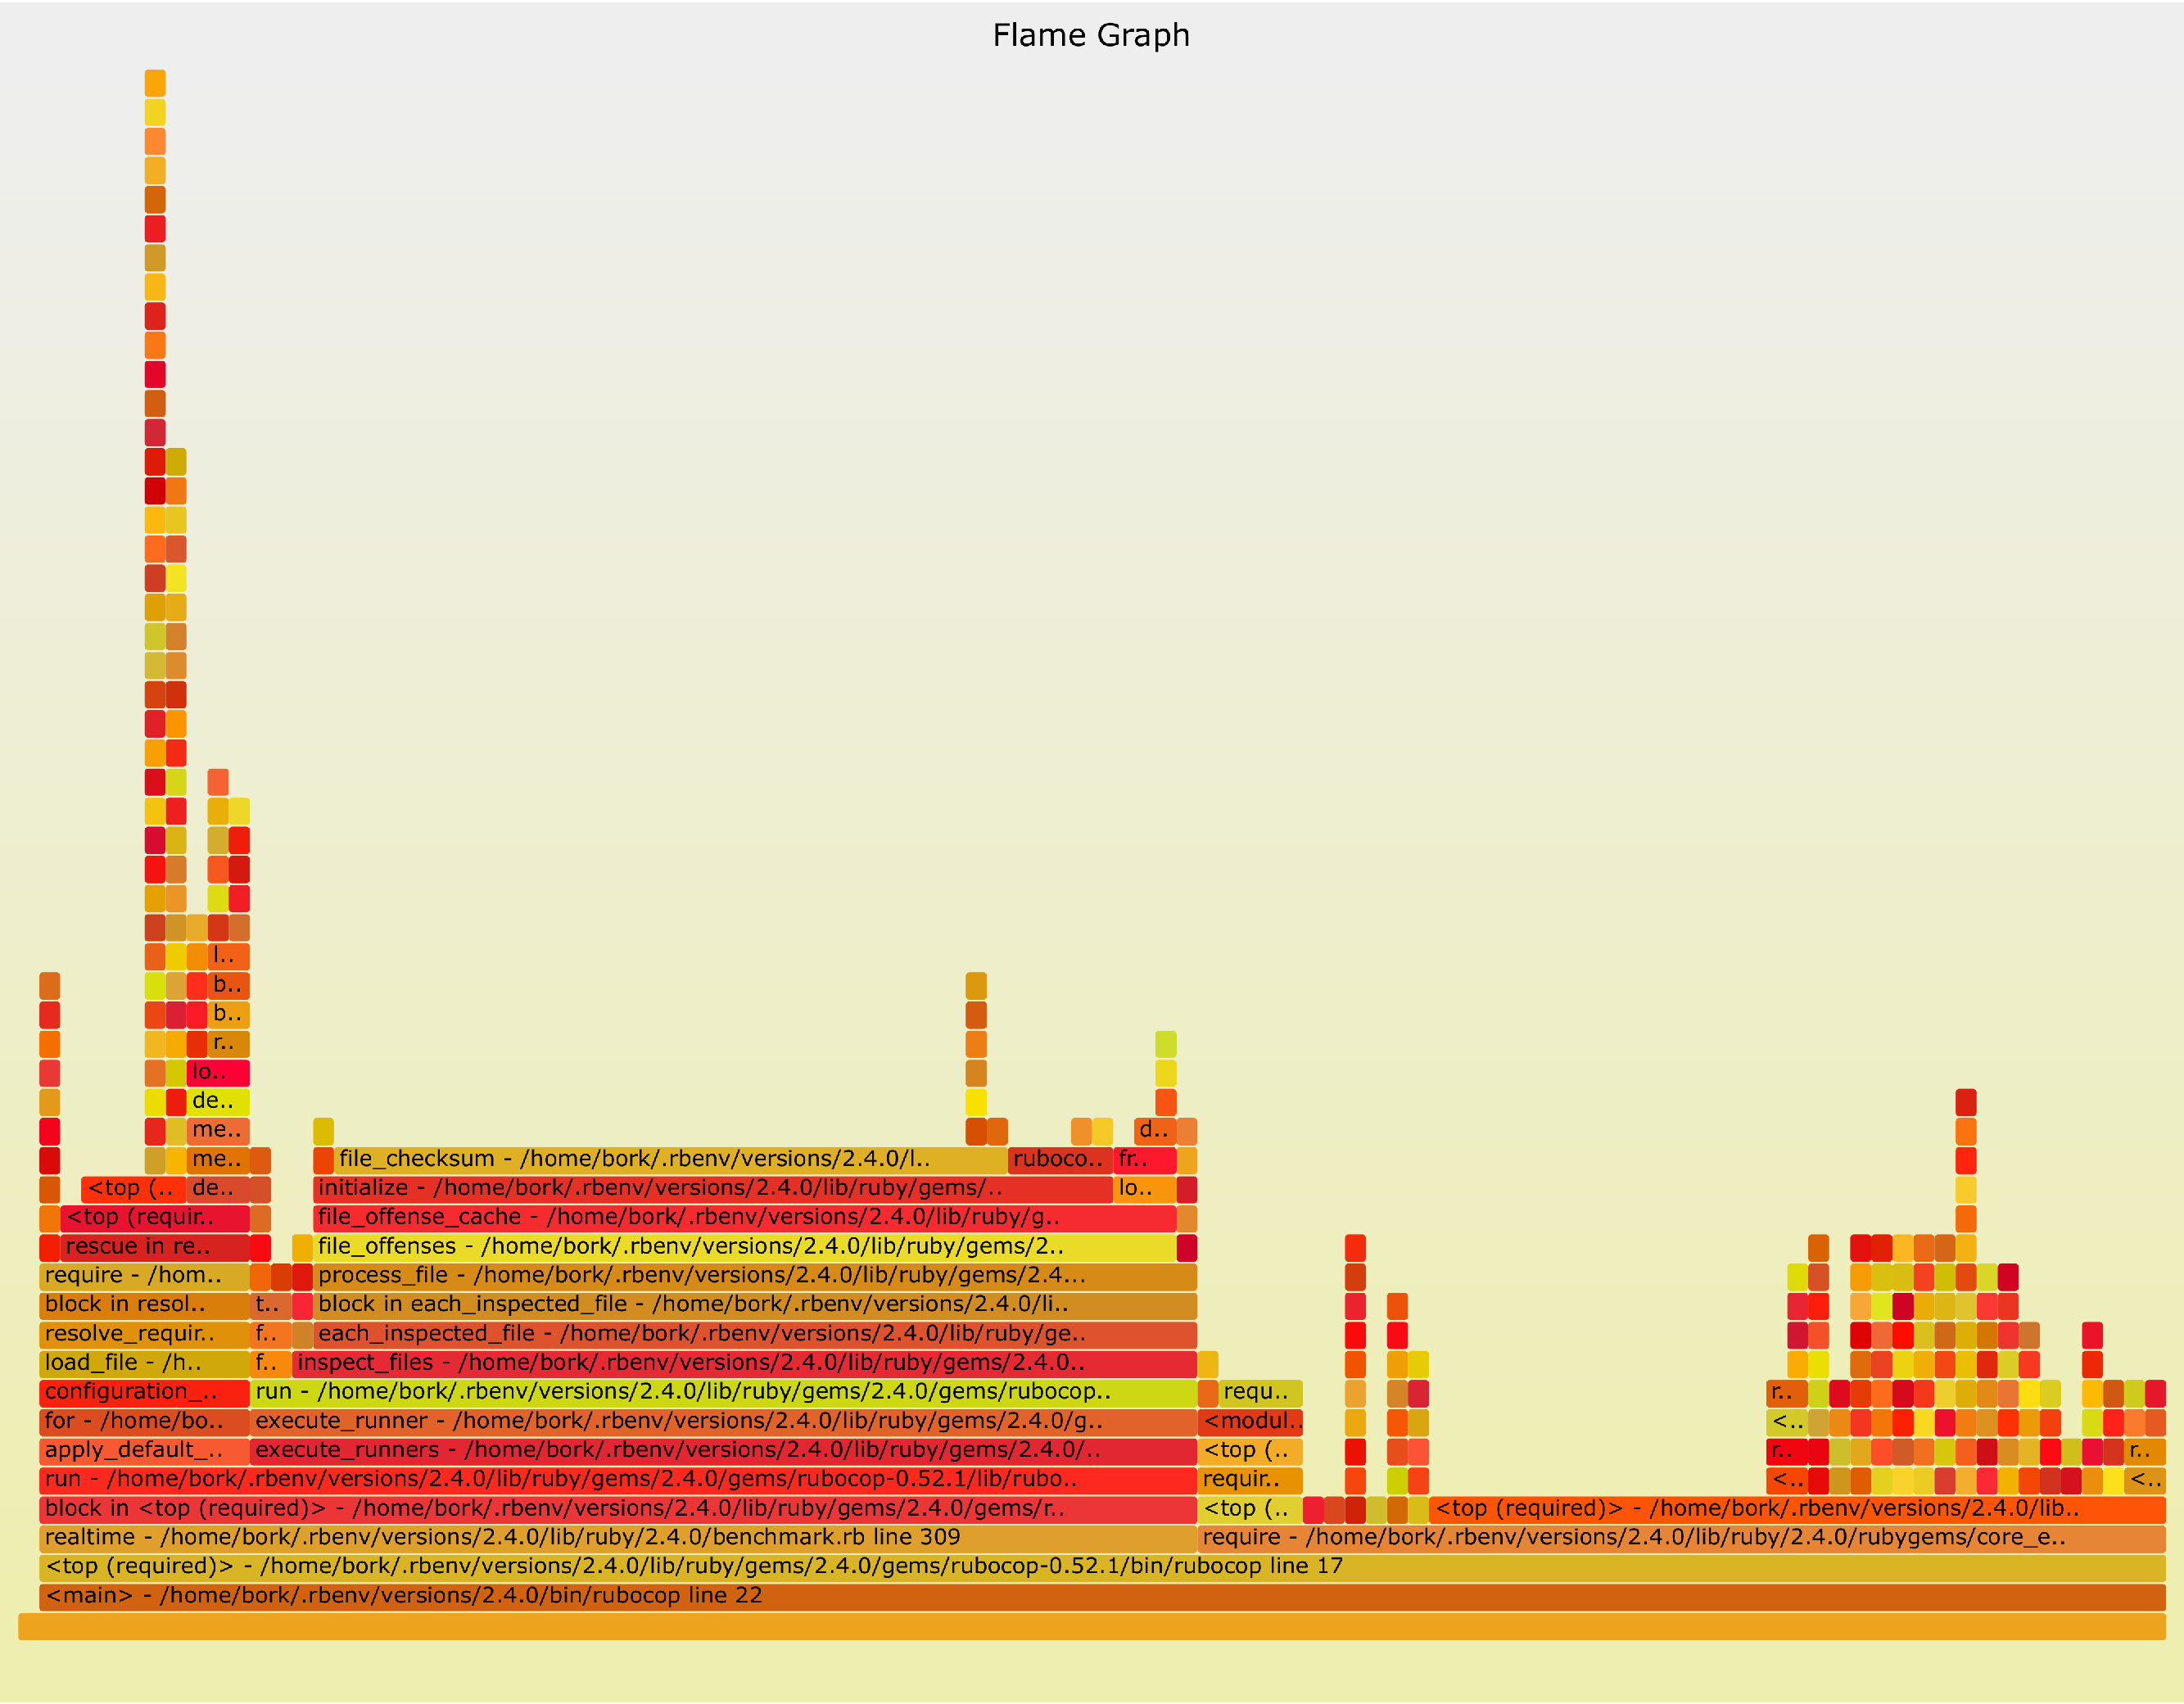
First, here’s what Rubocop looks like when linting when it has a cache. (did you know Rubocop has a cache? I didn’t!). If you click to zoom in you’ll see that it spends 40% of its time doing file checksums which is not that surprising!
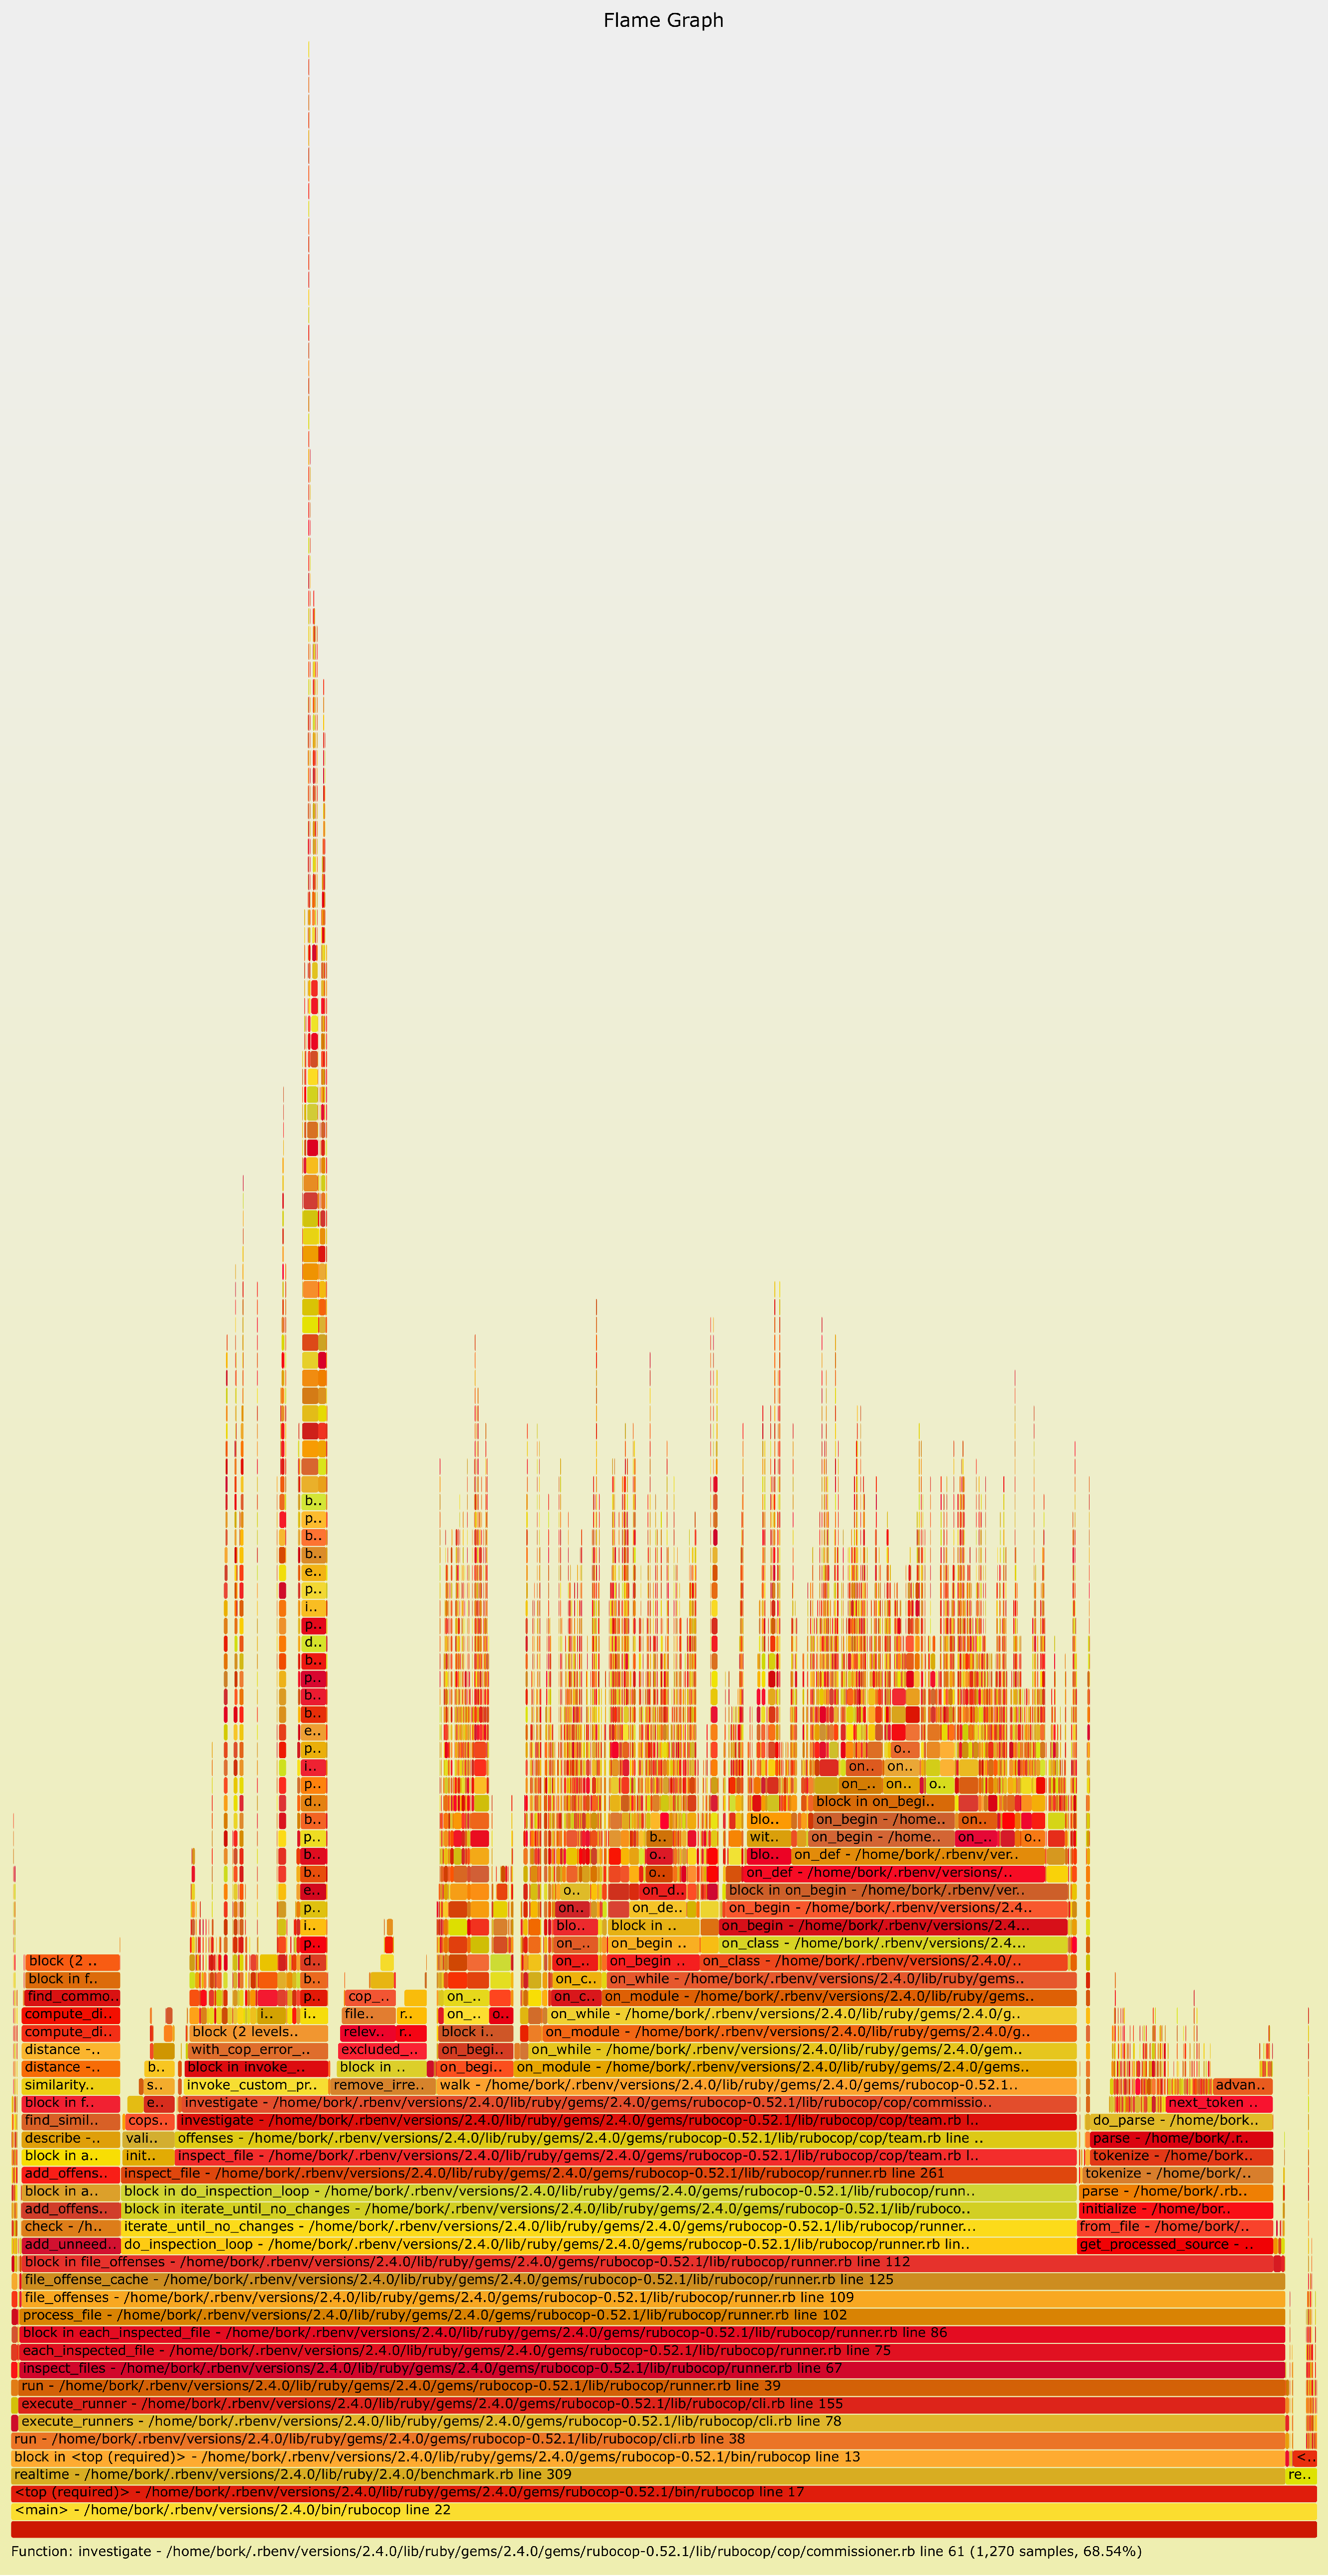
Here’s what Rubocop looks like when it doesn’t have a cache. Much more complicated! If you look
at the function calls, you’ll actually see that the call stacks are kind of weird – they look like
on_while -> on_module -> on_while -> on_begin -> on_begin -> on_def -> on_begin.... I think what’s
going on here is that Rubocop is going through the AST of the program it’s linting and calling a new
function for each part of the AST. So the call stack of Rubocop basically reflects the structure of
the program it’s linting, which is kind of interesting.
this week’s goal: first experimental release!
Since it’s working so well (there are lots of problems but it’s producing useful output!!), this week my goal is to release a first experimental release.
The week’s release should feature:
- support for seeing which line number your code is spending most of its time on.
- support for generating flame graphs (maybe?)
- lots of bugs that I don’t know about yet =)
- relatively readable code
- a license & contributing guidelines
- a name for the profiler!!!
Back to work!