tcpdump is amazing
It took me 2 years, but I think now I love tcpdump. Before we go into why – what’s tcpdump?
tcpdump is a tool that will tell you about network traffic on your machine. I was scared of it for a long time and refused to learn how to use it. Now I am wiser and I am here to show you that tcpdump is awesome and there is no need to be scared of it. Let’s go!
tcpdump: the basics (or: how not to use it)
If I just run sudo tcpdump -i wlan0 (listen to wireless network traffic plz!), tcpdump says this:
23:48:26.679315 IP 206.126.112.170.https > kiwi.lan.47121: Flags [P.],
 seq 1:42, ack 2294, win 1672, options [nop,nop,TS val 675931991
  ecr 60685517], length 41
The first time I ran tcpdump I took one look at some output like that, went WELP NOPE NOPE NOPE NOPE NOPE NOPE and gave up on tcpdump. what is an ecr? a win? flags? oh god.
I don’t know what hardly any of this means (though, I wrote a tiny TCP stack one time so I sorta know. But not enough to help too much.)
So, we’ve learned that we need to pass some… options… to tcpdump to actually make use of it without being a TCP wizard. But what options? We’ll find out! First, let’s get concrete about the problems we’re trying to solve.
the case of the slow HTTP request
Let’s suppose you have some slow HTTP requests happening on your machine, and you want to get a distribution of how slow they are. You could add some monitoring somewhere inside your program. Or! You could use tcpdump. Here’s how that works!
- Use tcpdump to record network traffic on the machine for 10 minutes
- analyze the recording with Wireshark
- be a wizard
The secret here is that we can use tcpdump to record network traffic, and then use a tool that we’re less scared of (Wireshark) to analyze it on our laptop after.
Let’s do it! Let’s say I want to record all TCP traffic to port 80 (so, HTTP). Then I can record traffic with
$ sudo tcpdump -i wlan0  \
               src port 80 or dst port 80 \
               -w port-80-recording.pcap
This filters for only packets to or from port 80 (the name for this syntax is “pcap filters” and they are THE BEST) and saves a recording to port-80-recording.pcap.
Next up, Wireshark! I’m going to start it with wireshark port-80-recording.pcap
Here’s what we see to start:
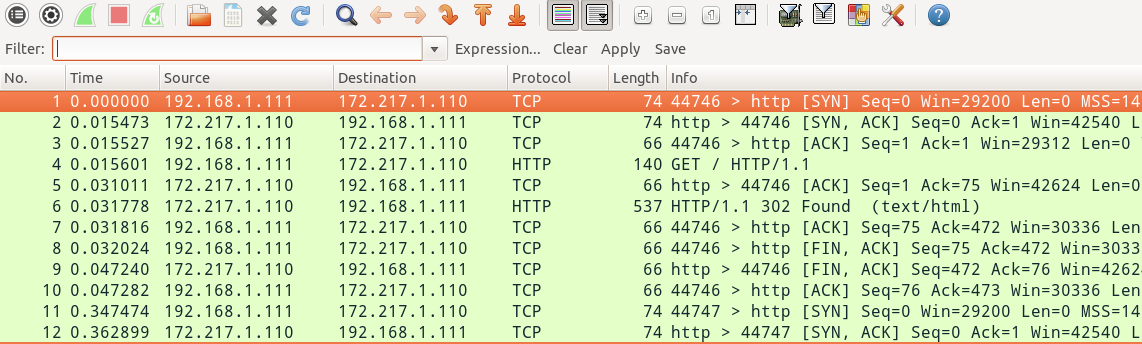
That’s a little intimidating. Every time I make a HTTP request that might be 200 TCP packets, which are a huge pain to recognize and make sense of by hand. But we can fix it! I clicked on Statistics -> Conversations, where it organizes all these disparate packets into TCP sessions. Let’s see what that looks like!
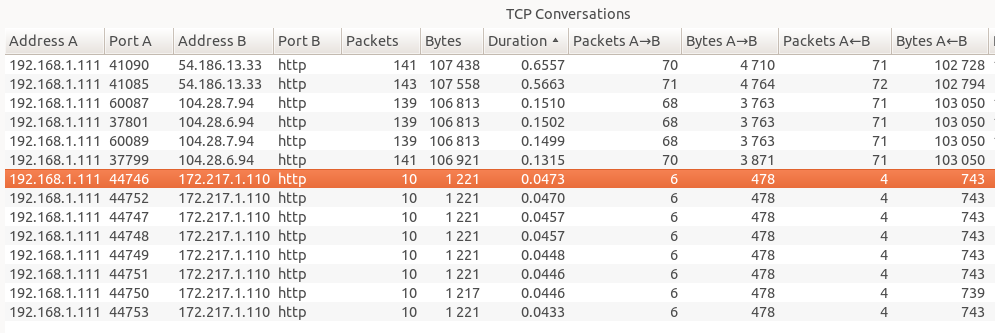
This is already a lot more understandable, to me! There were 12 or so HTTP requests that happened. There’s a ‘Duration’ column that tells me the total duration of the TCP session. So some of my requests took 47ms, and some of them took 655ms. The 47ms ones are Google, and the 655ms one is ask.metafilter.com. What’s up, Metafilter? Who knows. Metafilter was sending me way more packets (google was just like “lol redirect”, 10 packets, done), so I get that it takes more time. No big deal. That was super easy!
I did this at work recently because my metrics were reporting that some HTTP requests were taking like 100ms each. I ran tcpdump, did the Wireshark thing above, and Wireshark was like “yeah those are all taking 3ms. Your metrics are wrong, or at least counting something other than just the network request!”. This was a very helpful fact to know.
With tcpdump I feel really confident that it’s telling me the truth about what my network traffic is up to, because that’s literally its whole job. And I can just capture packets and use it with Wireshark which is a really friendly and delightful tool.
pcap files
I mentioned really briefly that tcpdump lets you save pcap files. This is awesome because literally every network analysis tool in the universe understands pcap files. pcap files are like freshly baked chocolate chip cookies. Everybody loves them.
Filtering packets
Okay, so now let’s imagine we’re on a box where a lot is going on. We want to capture some TCP traffic to analyze it later. But not all the traffic! Only some of it. I mentioned before that you use “pcap filter rules” to do this. I only know how to do literally 2 things – filtering on port and IP address. Here’s the 3 second Julia tutorial on pcap filter rules.
stuff being sent to port 80:
    dst port 80
you can use booleans!
    src port 80 or dst port 80
here's how to filter on IP:
    ip src 66.66.66.66
I don’t know why it’s src port $ip but ip src $ip. If I get it wrong I just
try to switch the order. You can go read the pcap-filter man page and do much more
complicated filtering but this has been good enough for me so far.
Overhead (is it safe to run tcpdump on my production machine?)
short answer: I think so, mostly.
Longer answer: I don’t quite know. But here’s what I do know.
I watched this great talk by Dick Sites, who works at Google (which you should totally watch if you’re into awesome performance stories) where he mentioned that any time he introduces a performance monitoring tool that takes up more than 1% of resources in overhead, he needs to have a long serious conversation with the datacenter administrators. He said that tcpdump is an example of something that’s too expensive.
But I don’t think his requirements are my requirements (if a thing I administer gets 5% slower for 10 minutes while I collect network packets, it’s no big deal).
tcpdump uses this pcap filter language, and thomas ptacek mentioned to me on Twitter the other day that those filter rules are compiled down to something super efficient (with an optimizing compiler?).
My impression is your filter rules are collecting 500KB/s or something of network traffic, it’s probably no big deal and you can go nuts with tcpdump on your production machines. If you’re Netflix and you’re trying to save 200MB/s of packets to disk, probably you will have a bad time? I don’t know. I’ve never observed any bad effects from using tcpdump, but I do look dstat to get a sense for how much network traffic I might be capturing first, and try to filter appropriately.
use -n to print the IP addresses
By default, tcpdump will try to do a reverse DNS lookup on every IP address to
turn it into a hostname. I usually want to see the IP addresses more than I
want to see the hostname, so I like to turn that off with -n.
The output with -n looks like this:
$ sudo tcpdump -ni any example.com
09:36:10.837004 IP 192.168.1.173.49363 > 192.168.1.1.53: 287+ [1au] A? example.com. (52)
09:36:10.850843 IP 192.168.1.1.53 > 192.168.1.173.49363: 287 1/0/1 A 93.184.216.34 (56)
The any is telling tcpdump to capture packets on any network interface.
even more awesomeness: tshark can look inside your packets
So, now we know how to filter by IP and stuff, and use wireshark. Next, I want to tell you about tshark, which is a command line tool that comes with Wireshark.
tcpdump doesn’t know about HTTP or other network protocols. It knows pretty much everything about TCP but it doesn’t care what you put inside your TCP packets. tshark knows all about what’s inside your TCP packets, though!
Let’s say I wanted to spy on all GET requests happening on my machine. That’s super easy with tshark:
$ sudo tshark -i any \
            -Y 'http.request.method == "GET"' \
            -T fields \
            -e http.request.method -e http.request.uri -e ip.dst
GET   /hello.html     54.186.13.33
GET   /awesome.html   172.217.3.131
GET   /               172.217.3.131
This filters for just packets which have a HTTP GET request in them, and then prints out the request method and the URI that we’re requesting for each one. It’s beautiful! I had no idea this was even possible before. But it gets better! HTTP is pretty easy. Everyone knows HTTP. But tshark doesn’t just know HTTP; it knows like EVERYTHING. Everything that Wireshark knows.
Yesterday at work, I wanted to know which Mongo collections were being queried from a specific machine. This was totally impossible with the tools I had. But nothing is impossible with tcpdump/tshark! It’s just network traffic, after all. So I ran something like this:
sudo tshark -i any \
            -f src port $mongo_port or dst port $mongo_port \
            -T fields \
            -e ip.dst -e mongo.full_collection_name
and since tshark totally understands the Mongo protocol, it immediately started printing out Mongo collection names, and I could see exactly what was going on. It was amazing. I’m super excited to use tshark more now.
go forth and tcpdump
If you have questions about network traffic on your machines, maybe tcpdump is the tool for you! If you have cool tcpdump stories or other ways to use it that I haven’t mentioned here, tell me on Twitter!.
Also if you understand how to reason about the overhead of using tcpdump (“below 2 MB/s is always ok”?), I would REALLY REALLY LOVE TO KNOW. Please tell me.
a zine on tcpdump
In 2017 I published a short free zine called Let’s learn tcpdump! with more tips.