As much as I write about how there’s a lot more to ML than training models, the actual statistical models you use are still really important! And I find understanding the models I’m using helps me sleep a lot better at night. So we’re going to talk about one.
I only do classification right now. Classification means that you have a
bunch of data with features (like (height = 5', weight = 150lb) and
you want to put each piece of data into a box (like assigned {female,
male} at birth). We’re only going to talk about classification where
there are 2 categories.
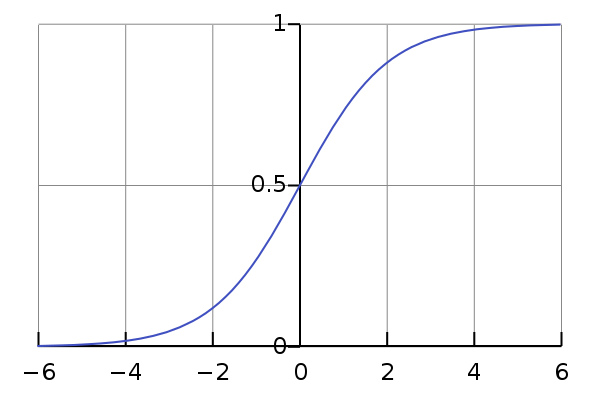
Logistic regression means that fit a linear model to your data (like
0.5 * height + 0.1 * weight). This gives you a real number, like
17.5. But 17.5 isn’t a classification, it’s just a number! So we put
the number into the logistic function 1 / (1 + exp(-x)) which
normalizes everything to be between 0 and 1. Then you can interpret the
number you get as a probability! In the case of 17.5, you can see from
the graph below that it corresponds to a probability of effectively 1.
You can interpret this as “we’re 100% sure that this data is labelled
with F”. (assuming 1 corresponds to F and 0 to M).
Simulating some logistic regression data
One way I really like to think about models and the assumptions that go into them is
- generate some data that fits the assumptions of the model
- fit the model to that data
- see if I get the results I expect!
This doesn’t always feel as satisfying as using Real World Data, but it’s a much better way to think about your assumptions.
So, let’s think about the logistic regression model backwards. Instead of starting with features and classifications and learning coefficients, we need to start with features and coefficients and generate classifications.
Let’s imagine our features are x = 2, y = 3 and our coefficients are
x - y = 2 - 3 = -1. And the output of the logistic function is 1 / (1
+ exp(-1)) = 0.73. So this means 73% of the time we’ll generate a
classification of 1 and the remaining 27% of the time generate a
classification of 0.
To recap:
- generate some features
- get the probability for each data point (`0.7, 0.2, 0.5, 0.5, 0.5, 0.5)
- choose
1or0for each point with that probability (1,0,1,0,0,0)
Let’s do it in code!
import pandas as pd
import numpy as np
# Generate 100,000 data points normally distributed
# with mean 0 and variance 1
# Our features are called 'panda' and 'elephant'.
dataset = pd.DataFrame({
    'panda': np.random.normal(0, 1, 100000),
    'elephant': np.random.normal(0, 1, 100000)
})
# The coefficients we're using are -1/3 * panda - 1/3 * elephant
x = - 1/3 * (dataset['panda'] +  dataset['elephant'])
# Put everything through the logistic function
probabilities = 1 / (1 + np.exp(-1 * x))
# A trick! np.random.uniform(0,1) < 0.7 is 1 with
# probability 70% and 0 with probability 30%
dataset['target'] = np.random.uniform(0,1, 100000) < probabilities
dataset.target.value_counts()
# Check that the target values are roughly evenly distributed
True     50032
False    49968
There’s of course no reason to expect that the target values would be evenly distributed between True and False – I mucked with the coefficients to make them that way.
Let’s see some of this data on a graph:

You can see that there’s a separation between the True and False
data, but a lot of it is mixed up together. This is because that there
were a lot of points that had a probability of ~50% of being True.
You can also imagine having much better separation between the data, like this:

Okay, great, we have our Amazing Mathematically Perfect Data. time to fit a model to it! (more on what I mean by Amazing Mathematically Perfect Data later!)
Fitting a model
Here’s the model-fitting code. It
- splits everything into a training set and testing set
- fits the classifier on the training set
- makes predictions on the test set
I’m glossing over all the math here, but “fitting the classifier” in this case means “do a maximum likelihood estimate to find the best coefficients, using gradient descent”. Not totally sure about the gradient descent.
from sklearn.linear_model import LogisticRegression
from sklearn.cross_validation import train_test_split
from sklearn.metrics import confusion_matrix
cls = LogisticRegression()
features = dataset[['elephant', 'panda']]
features_train, features_test, target_train, target_test = train_test_split(features, dataset['target')
cls.fit(features_train, target_train)
predictions = cls.predict(features_test)
Let’s look at what our model predicted!

Interesting! It’s much easier to understand what the logistic regression
is doing now – it’s choosing a line, and classifying everything on one
side of that line as True and everything on the other side as False.
Did the model fitting work?
There are a couple of ways to think about this.
The first question you can ask is – how different is the graph of predicted classification from the graph of actual classifications?
Just by inspecting them, you can see they’re pretty similar. You can formalize this a bit more by looking at the confusion matrix:
[[8992 3512]
 [3338 9158]]
which tells you that we classified 8992 + 9158 things correctly, and 3512 + 3338 things wrong. Here’s another question I’m interested in, though, that’s newer to me:
For each data point, as well as getting a classification (True or False), we actually get a probability. Do those probabilities make sense?
What does “make sense” mean? Well, let’s say I have a data point which is assigned a probability of 0.8. Then I’d expect 80% of those points to be Trues (or orange) and 20% to be Falses (or blue). Let’s find if that’s true! We’ll plot the score vs the actual proportion of Trues. (thanks to Avi for suggesting that I start drawing this graph!)

This graph is BEAUTIFUL. It is basically a perfect straight line. I could not dream of a more beautiful graph. I have never yet seen a graph this nice for actual data. (actual data doesn’t care what you think the model is :( ).
This is what I meant when I said that we have Mathematically Perfect data – not that the data lets you easily perfectly separate the two classes (it doesn’t!), but that it fits the assumptions of the model.
That’s all I have to say about logistic regression for now! I’m still working some of these things out, and if I’ve gotten anything terribly wrong I’d love to know about it.
If you’re interested in reproducing this you can see the code for it here.
Questions I still have that I’d love answers to:
- Why do we even think this model seems reasonable in the first place? Is there some mathematical justification to believe that data might fit it (like with the central limit theorem), or do we just use it because it works?
- Do you know any datasets that give you a really pretty graph where the actual proportions match up with the predicted scores?
- When I fit a logistic regression model, should I worry about the MLE not converging to an optimal set of coefficients? When does that happen? (when the data is badly scaled?) Is it easy to construct an example where that happens?
- Are there more ways of thinking about logistic regression that I’m missing here?