I often want to know how much memory my processes are using. When I run
top, I see this:
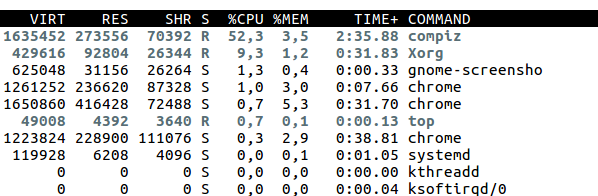
For years I’ve been reading explanations of the VIRT, RSS, and SHARED columns and for years I’ve been like “ugh, why is this so complicated, why can’t I just know how much memory my process is using, this is silly.
Today I read the super-helpful article htop explained, and together with learning a little bit more about how virtual memory works on Linux, I think I understand what’s going on!
The short version is “the way memory works on Linux is just fundamentally more complicated than ‘process Y is using memory X, so asking ‘how much memory is my process using’ can only ever have approximate answers’
For all this to make sense, first we need to understand how virtual memory works and we’re going to learn what a “page table” is.
virtual memory & the page table
You have RAM in your computer (i have touched mine with my hands!). That RAM has addresses, and data lives at addresses in RAM.
When you access memory in your program (like “0x39242345”), those addresses are not physical RAM addresses. They’re “virtual” memory addresses, that are specific to your process. I wrote a comic about how this works:

Here’s a text version of that comic:
- every process has its own memory space (so
0x39242000might point to “dog” in one process and “cat” in another process) - The virtual memory addresses like
0x39242000map to physical RAM addresses, and diferent processes have different mappings - The mapping of virtual -> physical addresses is different for each process! The mapping is generally done one 4 kilobyte block at a time
- The virtual -> physical addresses map is called the page table
I’d heard about the page table before, but one thing that was really confusing to me until yesterday was – how do these lookups of virtual addresses happen, exactly? Wouldn’t doing a lookup in a table every single time you access memory be really slow?
The answer is that your CPU itself does the lookups in the page table! It knows which part of physical RAM the mapping for your process lives in, and then every time it executes an instruction that accesses memory, it looks up which real physical memory it needs for that instruction in RAM.
When you switch processes, the kernel updates the address of the page table so that the CPU knows where to look.
side note: page tables & caches
You might be thinking “wow, does that mean that every time I do a memory access I actually have to do two memory accesses”? And you would be right! It is kind of expensive to do that.
Your CPU helps make this faster by caching page table lookups in the translation lookaside buffer (TLB). This is a super fast cache and if your virtual memory address is in the TLB then you just need to do 1 memory access to access memory instead of 2.
I think if you access your memory in a predictable way (like access a bunch of memory all at once, your CPU can do smart optimizations like “huh, I’m going to need to look up that address in the page table next, I will preload it into the TLB”). This is because modern CPUs are not actually linear things, but do all kinds of operations at the same time.
At this point we’re deeper in hardware optimizations than we need to be for the purposes for this blog post, and besides I’ve already probably said something wrong about how hardware works, so let’s go back to discussing how much memory our processes are using :).
shared memory
Now that we understand how memory accesses work on Linux, we can talk about the first complicated thing: shared memory. Here is a comic about copy on write.

So, this is weird! This means that 2 processes can be using exactly the same physical memory. And worse, that shared memory could be scattered in totally random places through the process (so you could have 4MB of non-shared memory, then 8MB of shared memory, then more unshared memory, etc.)
There’s no clean way to logically split up shared and non-shared memory. Basically any 4 kilobyte page could be shared or not shared. This is great for performance (less copying!) and reducing memory usage, but makes it hard.
So I could be running 16 Google Chrome processes, and you could have
- some memory that all of them share (C libraries)
- some memory that only a few of them share
- some memory that is shared for a while, and then slowly becomes unshared over time
You could imagine counting every single page of memory, saying “okay,
that page is shared by 6 processes, I will divide it by 6 and
attribute that amount to my process”. This seems like a resaonable way
to count memory to me. It turns out that you can actually do this
somehow via /proc/$PID/smaps and the PSS column but I have not
investigated this yet and it is not how top reports memory use.
swap and mmap
The next (and, I think, last) reason counting memory is complicated is that not all virtual memory actually maps to physical memory.
You might have heard of swap!!
In your page table, instead of a virtual memory address being mapped to a physical address, you can map it to “EMERGENCY ASK THE OPERATING SYSTEM FOR HELP”. (basically null or something). When the CPU comes across this, it’ll be like “what the hell is this, operating system, please fix it”. (the technical term is a “page fault”)
At this point the operating system could in principle do whatever it wants, but usually the reason this is happening is that that virtual memory address is actually some data on disk. So the operating system will go read the data from disk, put it into physical memory, and then the CPU will go merrily on its way and keep running your code.
There are two normal reasons you might have memory addresses that actually map to the disk:
- swap: your operating system actually ran out of physical memory so it put a bunch of data from RAM on disk
- a program asked your operating system to do it with mmap. Basically if you want to read a 1GB file, you can say “hey, please map this file into memory, and just load it lazily when i access that memory”. This can have better performance than reading the file normally, and it’s a very common pattern.
how much memory is my program using?
Okay, we know about a bajillion things about how memory works on Linux now! Let’s go back to what we saw in top.
“VIRT” means “this is how much virtual address space this program has”. This could be mmaped files, and all kinds of stuff that does not actually live in physical memory at all. This number is not really that useful if you want to know how much RAM you’re using.
RSS (resident set size) is much closer to your normal notion of “how much memory I am
using” – it’s the amount of actual physical RAM that is used by that
process in some way. For example, in the table above compiz is using
1.6GB of virtual memory but only 270MB of actual real RAM.
SHR is the amount of physical RAM for that process that is shared with other processes. I think you have no way of knowing how many other programs that RAM is shared with, or if it’s likely to continue being shared in the future (like if it’s copy-on-write shared memory). We can see that half of Google Chrome’s memory is shared with other processes (probably other Chrome processes).
%MEM is the percentage of physical RAM that the process is using. so it’s RSS divided by total physical memory.
i feel way better
I’ve been confused about this for years so it feels nice to actually understand what these numbers mean and why there are so many of them and why it’s so confusing. It turns out that virtual memory systems are kinda complicated, but that if I understand the basics it helps to clear up a lot of confusion! Awesome.