This post is about the paper Rigorous benchmarking in reasonable time.
A few months ago Julian told me about a paper called Printing Floating-Point Numbers: A Faster, Always Correct Method. There are two really remarkable-to-me things about this paper.
First: I didn’t know that printing floating point numbers was a research problem! The core problem is that – there are a finite amount of 64 bit floating point numbers (about 2^64 of them!). So for any number, there are one or two closest floating point numbers to that number. 0.21 and 0.21000000000000002 are very close! So close that there’s no floating point number between them. You can see this in Python:
>>> print 0.21
0.21
>>> print  0.21000000000000002
0.21
This isn’t a mistake on Python’s part; this is just how floating point works. This means that printing a floating point number is nontrivial – in principle it’s not incorrect to render 0.21 as 0.21000000000000002, but probably you want to print the shortest version of the number. So this paper talks about how to do that correctly. I love learning about programming problems (that are solved on my computer every day, when serializing numbers into JSON!) that I didn’t even know existed.
The second interesting thing in this paper is – the original result said they had an algorithm to print floating point numbers which was
- always correct (as short as possible)
- ran 2x faster than the fastest known (approximate) algorithm
This turned out to be wrong – it was actually 2x slower than the approximate algorithm (it’s still an improvement on the state of the art in exact algorithms). They talk about what happened in their README.
I don’t point this out to make fun of the researchers for coming up with an incorrect result. I’m pretty sure they’re way better at performance analysis than I am. Instead, I think this is a really good illustration that benchmarking programs and figuring out which one is faster is really hard – much much harder than you might think.
rigorous benchmarking in reasonable time
Okay, now to the actual point of this blog post. Julian also handed me a paper the other day called Rigorous benchmarking in reasonable time.
In this the paper, they start out by saying
- many performance results are small improvements (5-10%) – of those they surveyed, the median improvement advertised was 10%
- a 10% improvement is well within the bounds of error on a lot of experiments
- so you need confidence intervals around your benchmarks!
- but more than half of papers that talk about performance don’t publish confidence intervals
I’m less interested in the question of academic rigor here and more interested in the idea of benchmarking correctly in practice – I’d like to make programs faster, and a great way to make your stuff WAY FASTER is to make many small 5% improvements. So you need to actually be able to detect a 5% improvement.
independence
The first idea they talk about, which was new to me, was the idea that if you run a benchmark many times, it is important whether or not the run times converge to a sequence of iid samples. That is kind of mathy, so here are a couple of images illustrating what I think it means:
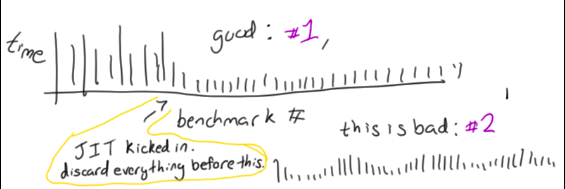
In the first one, at first everything is slow. Maybe the code is in Java, and the JIT hadn’t kicked in yet. But then the samples speed up, everything stabilizes, and you’re golden. You can probably meaningfully average them after that point (but remember to throw away the samples at the beginning!!).
In the second example, there’s this weird periodic pattern: the program is slow, then fast, then slow. You might think this is unlikely, but in the paper they talk about two benchmarks they ran – one got faster every time they ran it (for 200 iterations), and one got slower every time they ran it.
They say it’s not the end of the world if you have a situation like the second example – it happens! But you do need to be aware of it. They have specific recommendations for what to do in all these cases (read the paper to find out what they are!)
I found this really interesting because graphing the speed of a benchmark over time is certainly something I’ve never done (usually I just blindly take an average or something). Now I’m much more motivated to do it.
technique for checking independence: randomly shuffle
There are a lot of techniques for figuring out if a bunch of samples are independent. You can calculate a bunch of autocorrelation numbers and do mathy stuff. But! I really love statistical smoke tests where you can look at something visually and say “uh, no, that’s definitely broken”. They gave a really nice smoke test in this paper.
The idea is – if you have a series of benchmarks over time (like the periodic one I drew above), and then you randomly shuffle all of the benchmarks, does the randomly shuffled one look basically the same as the original? if not (like if the original was monotonically decreasing one, and the shuffled one isn’t), then it’s not independent!
benchmarking is hard. understanding your data is good.
I know that for Java there’s a benchmarking framework called JMH which is well regarded and solves a bunch of common benchmarking problems for you. I found this paper interesting because it didn’t advocate using a Smart Benchmarking Framework which Solves All the Problems For You, and instead explains how you can understand the properties of the code that you’re benchmarking and design a statistical analysis appropriately. I don’t know which is better!
But as a person who’s done a lot of data analysis, the idea that you should look at the data that you’re using to make an important decision (more than just calculating a single point estimate of the median / average) seems extremely reasonable to me.
Thanks for Julian Squires for the papers.