I am not actually on a plane to Puerto Rico, but I wrote this post when I was :)
Hey friends! I am on a plane to Puerto Rico right now. When is a better time to think about statistics?
We’ll start with a confession: I analyze data, and I rarely think about what the underlying distribution of my data is. When I tell my awesome stats professor friend this, she kind of sighs, laughs, and says some combination of
- “oh, machine learning people…”
- “well, you have a lot of data so it probably won’t kill you”
- “but be careful of {lots of things that could hurt you}!”
So let’s talk about being careful! One way to be careful is, when you come up with a number, to build a confidence interval about how sure you are about that number. I think the normal way to do confidence intervals is that you use Actual Statistics and know what your distribution is. But we’re not going to do that because I’m on a plane and I don’t know what any of my distributions are. (the technical term for not knowing your distributions is “nonparametric statistics” :D)
So, let’s say I have some numbers like: 0, 1, 3, 2, 8, 2, 3, 4 describing the number of no-shows for flights from New York to Puerto Rico. And that I also have no idea what kind of distribution this number should have, but some Important Person is asking me how much it’s okay to oversell the plane by.
And let’s say I think it’s okay to have to kick people off the flight, say, 5% of the time. Great! Let’s take the 5th percentile!
> np.percentile([0, 1, 3, 2, 8, 2, 3, 4], 5)
0.35000000000000003
Uh, great. the 5th percentile is there will be 0.35 people who don’t make the plane. This is a) not really something I can take to management, and b) I have no idea how much confidence I should have in that estimate, given that I only have 8 data points. And I have no distribution to use to reason about it.
Maybe I shouldn’t have switched to CS so I didn’t have to take statistics (true story). Or alternatively maybe I can BOOTSTRAP MY WAY TO A CONFIDENCE INTERVAL WITH COMPUTERS. If you’re paying close attention, this is like the A/A testing post I wrote a while back, but a more robust method.
The way you bootstrap is to sample with replacement from your data a lot of times (like 10000). So if you start with [1,2,3], you’d sample [1,2,2], [1,3,3], [3,3,1], [1,3,2], etc. Then you compute your target statistic on your new datasets. So if you were taking the maximum, you’d get 2,3,3,3, etc. This is great because you can use any statistic you want!
Here is some code to do that! n_bootstraps is intended to be a big number. I chose 10000 because I didn’t want to wait more than a few seconds. More is always better.
    from sklearn.utils import resample
    def bootstrap_5th_percentile(data, n_bootstraps):
        bootstraps = []
        for _ in xrange(n_bootstraps):
            # Sample with replacement from data
            samples = resample(data)
            # Then we take the fifth percentile!
            bootstraps.append(np.percentile(samples, 5))
        return pd.Series(bootstraps)
So, let’s graph it
    data = [0, 1, 3, 2, 8, 2, 3, 4]
    bootstraps = bootstrap_5th_percentile(data, 10000)
    bootstraps.hist()
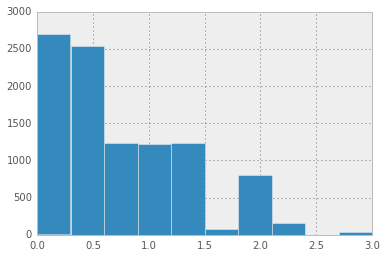
This is actually way more useful! It’s telling me I can oversell by 0 - 2 people, and I don’t have enough data to decide which one. I don’t know if I’d take this graph to airline executives (though everyone loves graphs right?!?!), but it’s for sure more useful than just a 0.35.
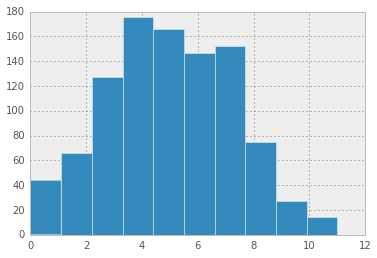
Thankfully in real life I would probably have more flights than just 8 to use to make this decision. Let’s say I actually had, like, 1000! Let’s start by generating some data:
data = np.random.normal(5, 2, 1000)
data = np.round(data[data >= 0]).astype(int)
Here’s a histogram of that data:
pd.Series(data).hist()
Now let’s take the 5th percentile!
np.percentile(data, 5)
2.0
Again, I don’t really feel good about this number. How do I know I can trust this more than the 0.35 from before? Let’s bootstrap it!
bootstraps = bootstrap_5th_percentile(data, 10000)
bootstraps.value_counts().sort_index().plot(kind='bar')
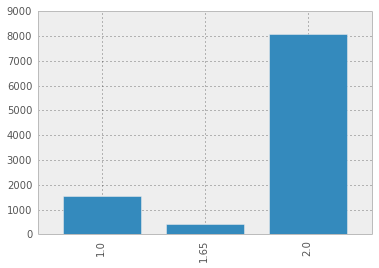
I feel a little better about calling it at 2 here.
The math
I have not explained ANY of the math behind why you should believe this is a reasonable approach, which if you are like me then you are super uncomfortable right now. For instance, obviously if I only have 1 data point, sampling with replacement isn’t going to help me build a confidence interval. But what if I have 2 points, or 5? Why should you take these histograms I’m building seriously at all? And what’s this business with not even caring about what distribution you’re using?
All worthwhile questions that we will not answer here today :).
Be careful
If occasionally 100 people don’t make the flight because they’re all from the same group and that’s important and not represented in your sample, bootstrapping can’t save you.
This method is the bomb though. It is basically the only way I know to get error bars on my estimates and it works great.